The Big Picture in the Crypto Market: Analysis of TOTAL, TOTAL2 and TOTAL3
When analyzing the crypto market, the TOTAL, TOTAL2 and TOTAL3 indices are the most critical indicators that allow us to understand the general situation of the market.
TOTAL (Overall Crypto Market Value) → Shows the market value of all crypto assets.
TOTAL2 (Altcoin Market Value Excluding Bitcoin) → Reflects the total value of all altcoins except Bitcoin.
TOTAL3 (Altcoin Market Value Excluding Bitcoin & Ethereum) → Measures the market value of altcoins other than Bitcoin and Ethereum.
These three data sets allow us to understand at what stage the market is and where investment opportunities may occur. Now let's examine each of them in detail.
TOTAL – The General Health of the Crypto Market
The TOTAL metric evaluates the overall market health by measuring the total market value of the 125 largest coins in the cryptocurrency market. This data, which includes Bitcoin, Ethereum and major altcoins, shows what level of liquidity is in the entire market and when bullish or bearish trends may start.
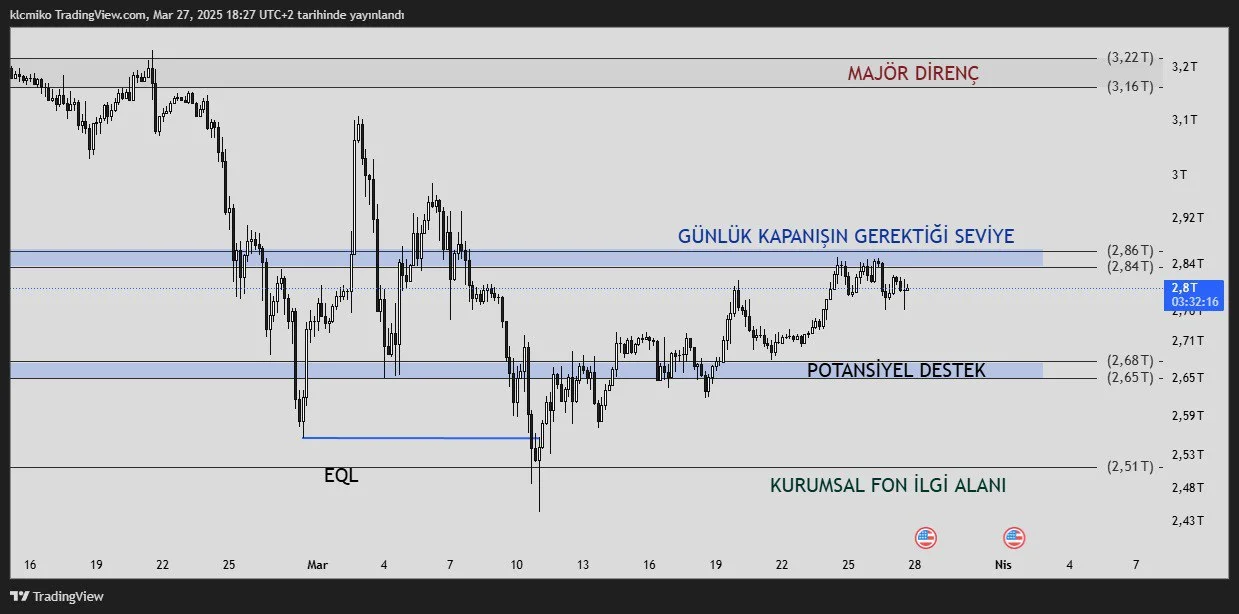
2.86T - Decision Point: The Region where the Market Trend is Determined
This level can be the determinant of a bullish or bearish trend.
The fact that weekly or 2-day closures come above this level confirms that buyers are dominating the market.
If the volume purchases continue, large funds and corporates may break this level, triggering the inflow of fresh money into the market.
If we stay below 2.86T, there may be retreats and corrections in the crypto market.
2.68T - Accumulation and Demand Zone
This is a support level that investors should pay attention to in the short term.
If the market consolidates and gathers strength in this region, we may see upward movements again.
If volume purchases do not come, it is likely that the price will sag to lower levels.
2.51T - Decline Scenario: The Buying Zone of Large Funds
If the 2.86T level is not exceeded, the price may be withdrawn here.
It is a region where institutional investors can make big purchases.
It could be an area of opportunity for long-term buyers.
3.16T - Profit Selling Area & New Highs
If the 2.86T level is exceeded strongly, its TOTAL value may rise to 3.16T.
When this region is reached, it is likely that investors will realize profits.
But if a volume break comes, we may see new highs in the crypto market
TOTAL2 - The Pulse of the Altcoin Market
The TOTAL2 metric measures the total market value of all altcoins except Bitcoin. This indicator is one of the most important data to understand whether the altcoin season has arrived.
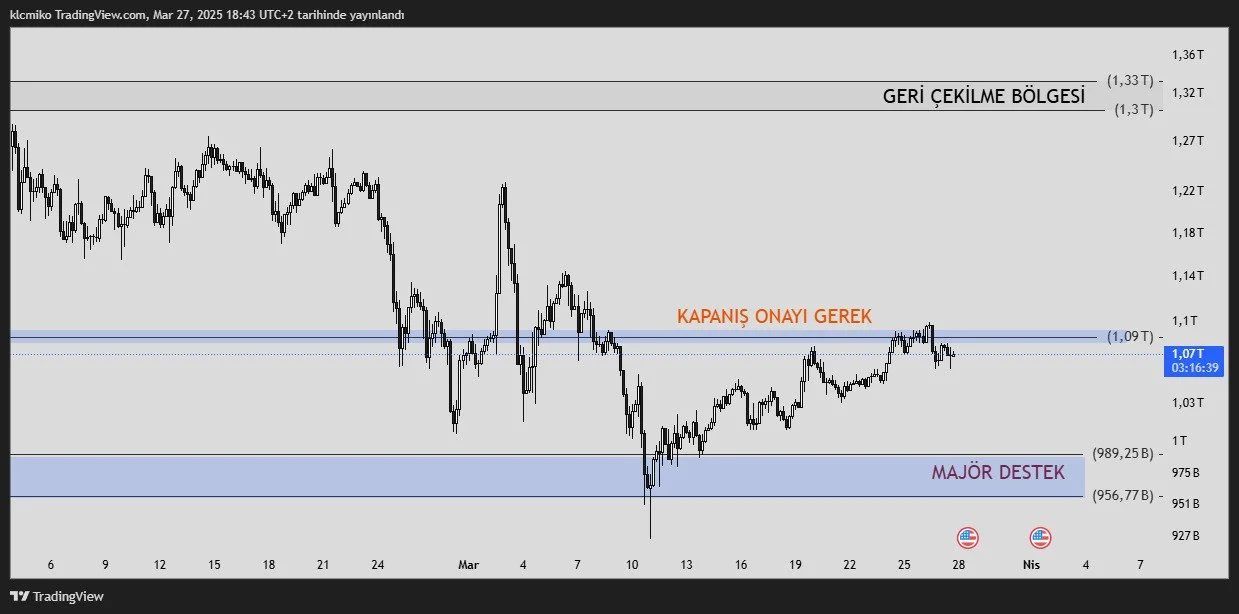
1.09T - Decision Level in the Altcoin Market
The fact that weekly closures occur above this level indicates the beginning of a strong upward trend in the altcoin market.
If we stay above this level, we can see big rises in Ethereum and major altcoins.
However, if the seller pressure is strong, the price may return to support levels again.
989B - 956B - Corporate Demand Zone
This region is a critical level where large investors and funds will show great interest.
If the price receives a strong reaction from here, we may see a big recovery in the altcoin market.
1,3T - Profit Realization and Withdrawal Area
It attracts attention as a region where altcoin investors will make profit purchases.
If the volume purchases continue, new peaks may be opened in the altcoin market.
However, if we encounter resistance at these levels, it is possible for the price to fluctuate for some time.
TOTAL3 - The Signal of the Altcoin Season
The TOTAL3 metric shows the total market value of all altcoins except Bitcoin and Ethereum. This chart is very important for us to understand whether the altcoin season has arrived.
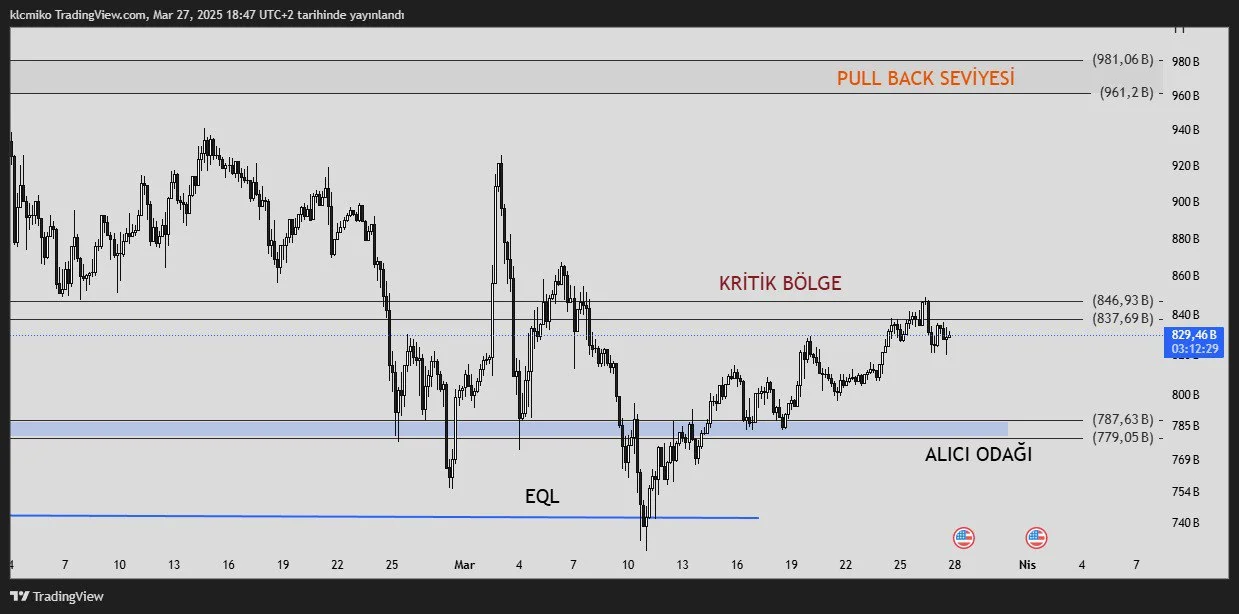
846B - Critical For Altcoins
If the weekly closes remain above this level, we may see hard rises of between 20 Dec-50% in altcoins.
A break of this level indicates that there will be a large flow of capital into the market.
787B - 779B - The Area of Interest of Large Funds
It is the region where institutional investors can make intensive purchases.
If a strong recovery comes from this region, we could see a big bullish wave in the altcoin market.
However, if the sellers remain strong here, the price may move horizontally for a while.
961B - 981B - Profit Realization & New Peak Potential
This region is an area where investors will consider taking profits.
If the price breaks this zone with a strong volume, we may see new ATH levels in the altcoin market.
However, if we are rejected in this region, there may be withdrawals in altcoins in the short term.
- TOTAL → Indicates the health of the overall market. If we exceed 2.86T, the journey to new heights can begin.
- TOTAL2 → Determines the status of the altcoin market except Bitcoin. If the 1.09T breaks, we could see a big altcoin bull.
- TOTAL3 → Gives the signal of the altcoin season except Bitcoin and Ethereum. The 846B breakage activates altcoins.
It is very important to follow these levels in order not to miss opportunities in the market.
By following these levels closely, you can see the opportunities and possible risks in the market in advance. These analyses, which do not offer investment advice, focus on support and resistance levels that are thought to create trading opportunities in the short and medium term according to market conditions. However, the responsibility for making transactions and risk management belongs entirely to the user. In addition, it is strongly recommended to use stop loss in relation to shared transactions.


