SUI Technical Analysis
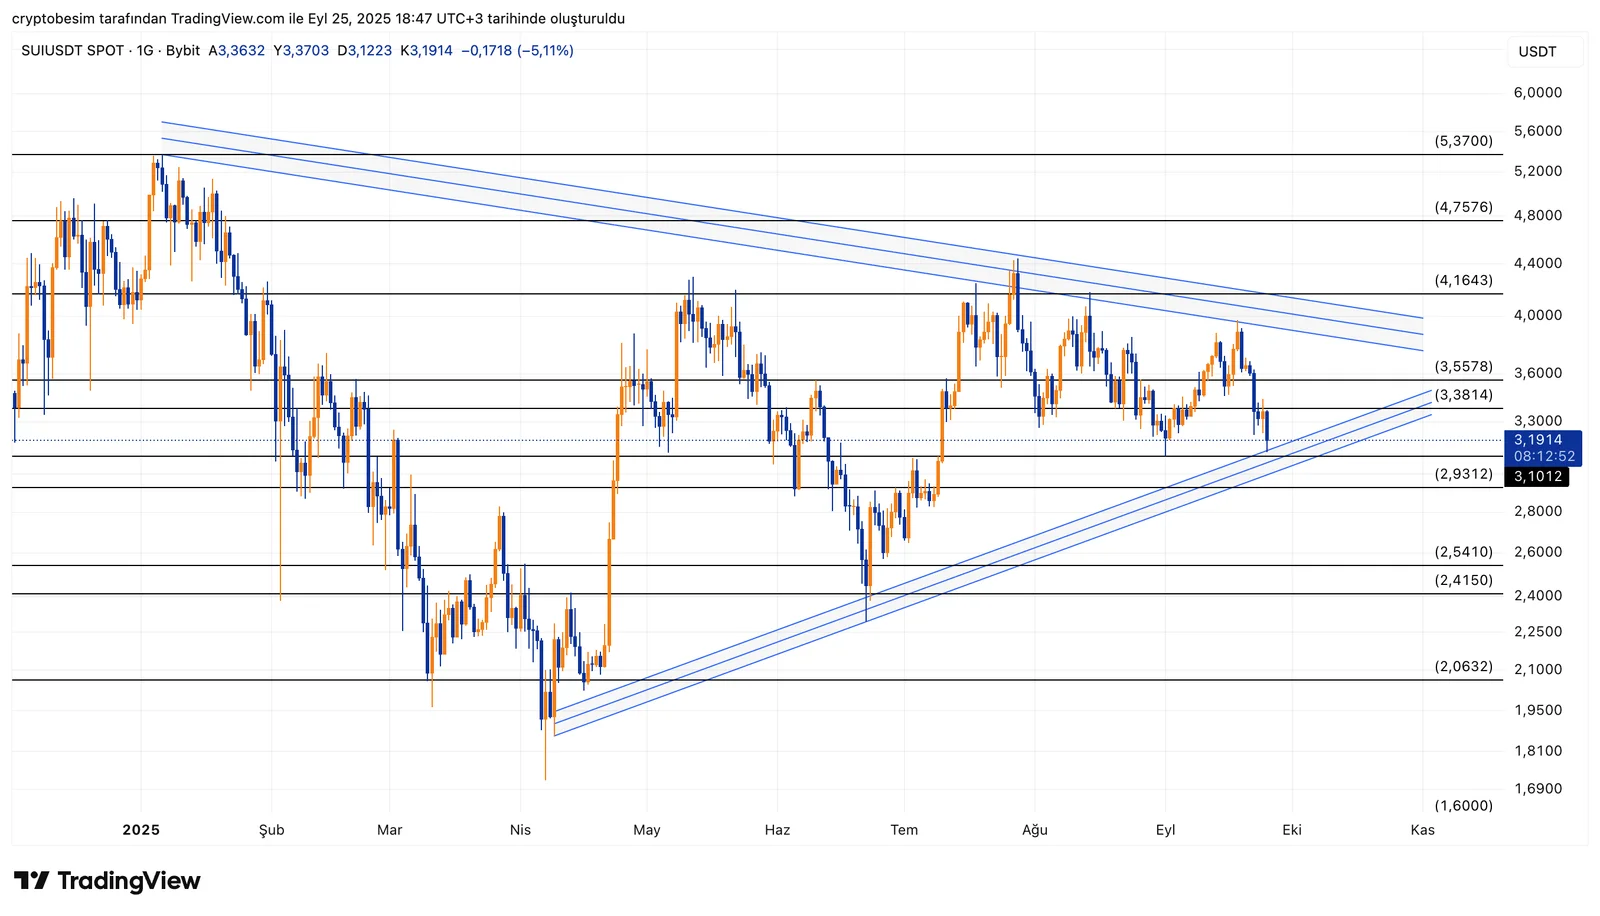
Analyzing SUI , we can see the narrowing symmetrical triangle formation. The price has been trapped between both the descending trendline from up and the ascending trendline from below. Such formations are usually known to trigger sharp price movements in the direction of the brekout.
SUI is currently trading around the level $3.19. The lower border of the channel is $3.10, being a key support level in the short term. Maintaining this support level means keeping the formation valid.
The first resistance zone is between the levels $3.38 - $3.55 according to a bullish scenario. We can expect the price to move toward the level $4.16 if it manages to hold above the resistance zone. Other technical targets above are $4.75 and $5.37.
In case the price closes below the level $3.10, support level $2.93 followed by the range $2.54 - $2.41 would come into play. In case of deeper correction, we should be following such levels as $2.06 and $1.60.
Levels to follow
- Support levels: $3.10 → $2.93 → $2.54 – $2.41
- Resistance levels: $3.38 – $3.55 → $4.16 → $4.75 → $5.37
These analyses, not offering any kind of investment advice, focus on support and resistance levels considered to offer trading opportunities in the short and medium term according to the market conditions. However, the user is responsible for their own actions and risk management. Morover, it is highly recommended to use stop loss (SL) during the transactions.


