
SUI Technical Analysis
Supported by nearly $6 billion in institutional funds and a strong increase in on-chain activity, SUI has been getting more attention recently. Additionally, a company’s $600 million treasury strategy and the network’s TVL approaching $2 billion have boosted investor interest. Now, let’s look at the technical side.
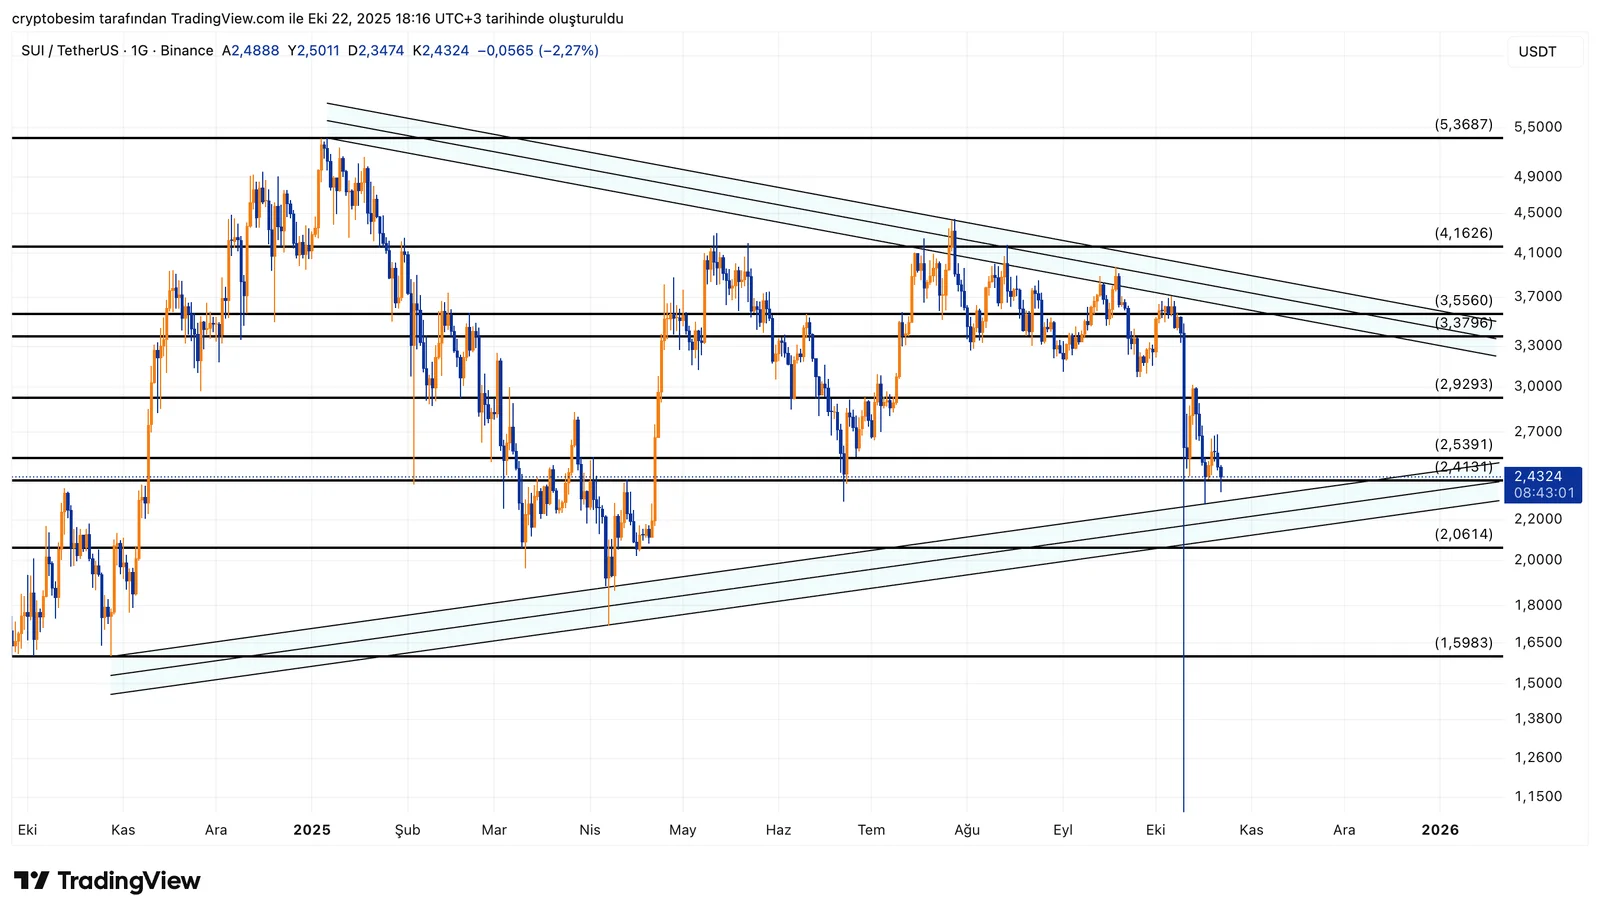
Analyzing the chart, we see that SUI is forming a symmetrical triangle pattern. The price has been moving between a descending resistance and an ascending support line, creating a tightening structure which most of the time leads to a strong breakout. SUI is currently trading around $2.43, very close to the lower boundary of the triangle. The $2.44–$2.53 area is acting as short-term support. If the price manages to hold above this zone, a recovery toward the middle of the triangle can be expected.
The first major resistance is around $2.93, which is also where the upper trendline passes. A daily close above this level would signal a bullish breakout, opening the way to $3.38 → $3.56 → $4.16, with a technical target near $4.50+ if momentum continues.
According to a bearish scenario, $2.24 and $2.06 are strong supports to follow below. If the price closes below $2.06, the pattern would break down, increasing the risk of a deeper drop toward $1.59.
Summary:
- SUI is still moving inside a symmetrical triangle pattern.
- Current price: $2.43, near a critical support zone.
- A break above $2.93 could trigger a strong move to $3.38 – $4.16 – $4.50+.
- As long as $2.24–$2.06 support holds, the outlook remains positive.
- The pattern is nearing completion — a strong trend breakout is expected soon.
These analyses, not offering any kind of investment advice, focus on support and resistance levels considered to offer trading opportunities in the short and medium term according to the market conditions. However, traders are responsible for their own actions and risk management. Moreover, it is highly recommended to use stop loss (SL) during trades.


