SUI Technical Outlook
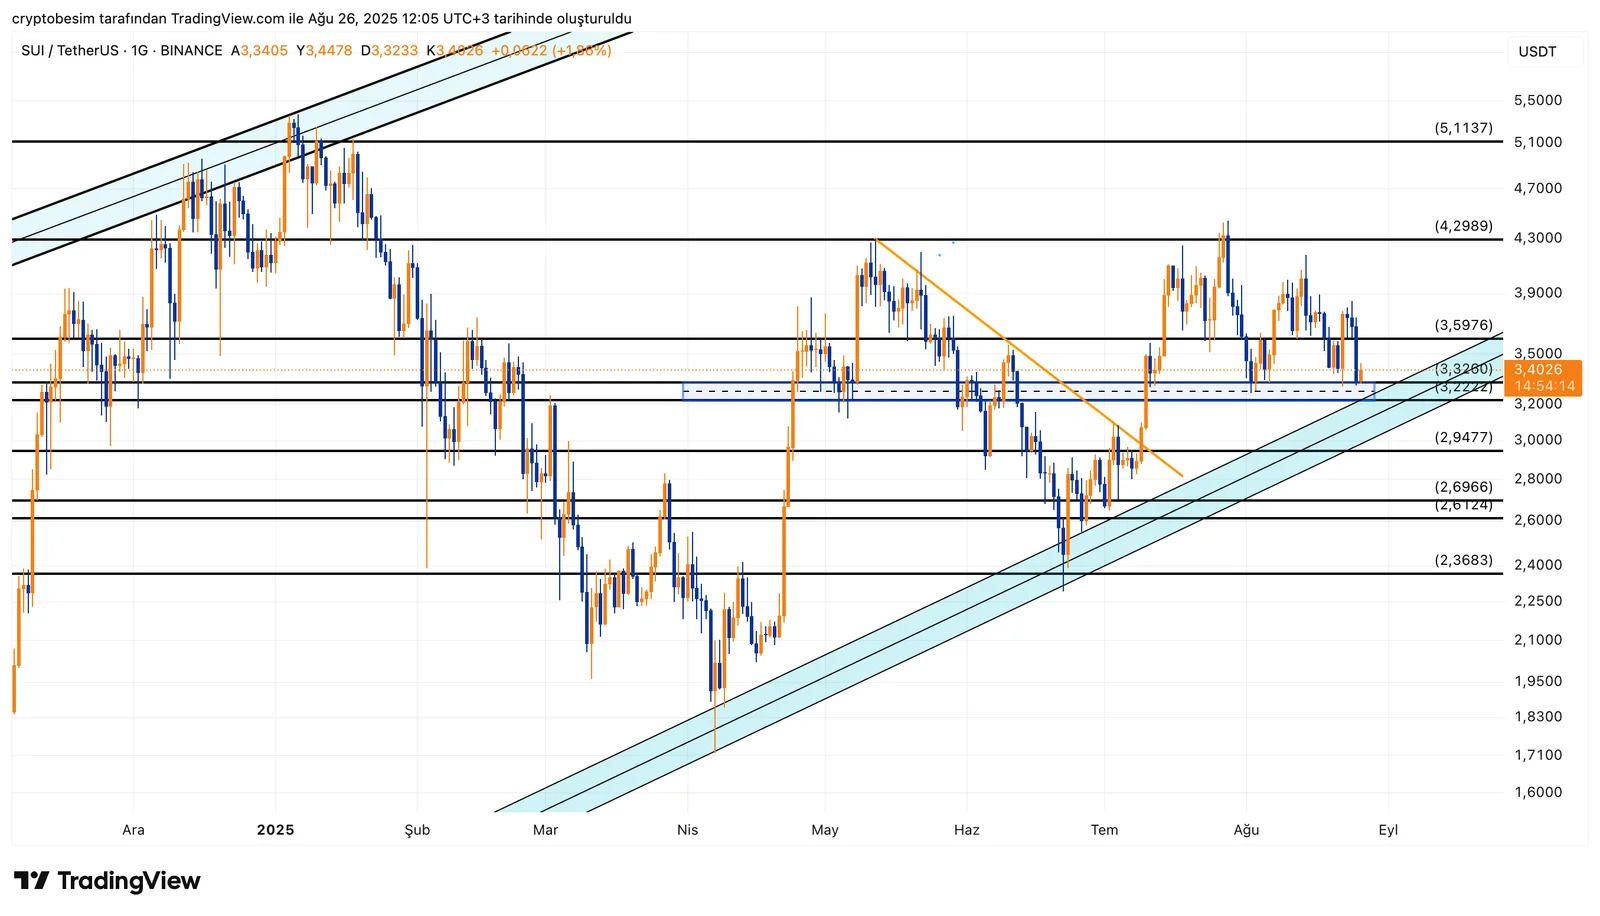
When we analyze the SUI current chart, we can see that the rising channel is still valid. SUI is currently trading around $3.40. We have the key support zone at $3.32 – $3.22, which was tested and gave a strong bounce. This area is also where the trendline meets, so it stands as an important defense.On the upside, $3.59 is the main short-term resistance. If this resistance breaks, price can climb toward $3.90 – $4.00. In the mid-term, $4.29 is a strong resistance. If this resistance gets broken, the next target could be $5.11.On the downside, if price falls below $3.32, the next supports are $2.94 and $2.69.

Summary
- Trend is inside an ascending channel, general outlook seems positive.
- $3.32 – $3.22 acts as a strong support, price bounced here.
- $2.94 and $2.69 are lower supports.
- $3.59 is the key short-term resistance.
- $3.90 – $4.00 is mid-term resistance.
- Above $4.29, price may target $5.11.
These analyses, not offering any kind of investment advice, focus on support and resistance levels considered to offer trading opportunities in the short and medium term according to the market conditions. However, traders are responsible for their own actions and risk management. Moreover, it is highly recommended to use stop loss (SL) during trades.


