
STRK Technical Overview
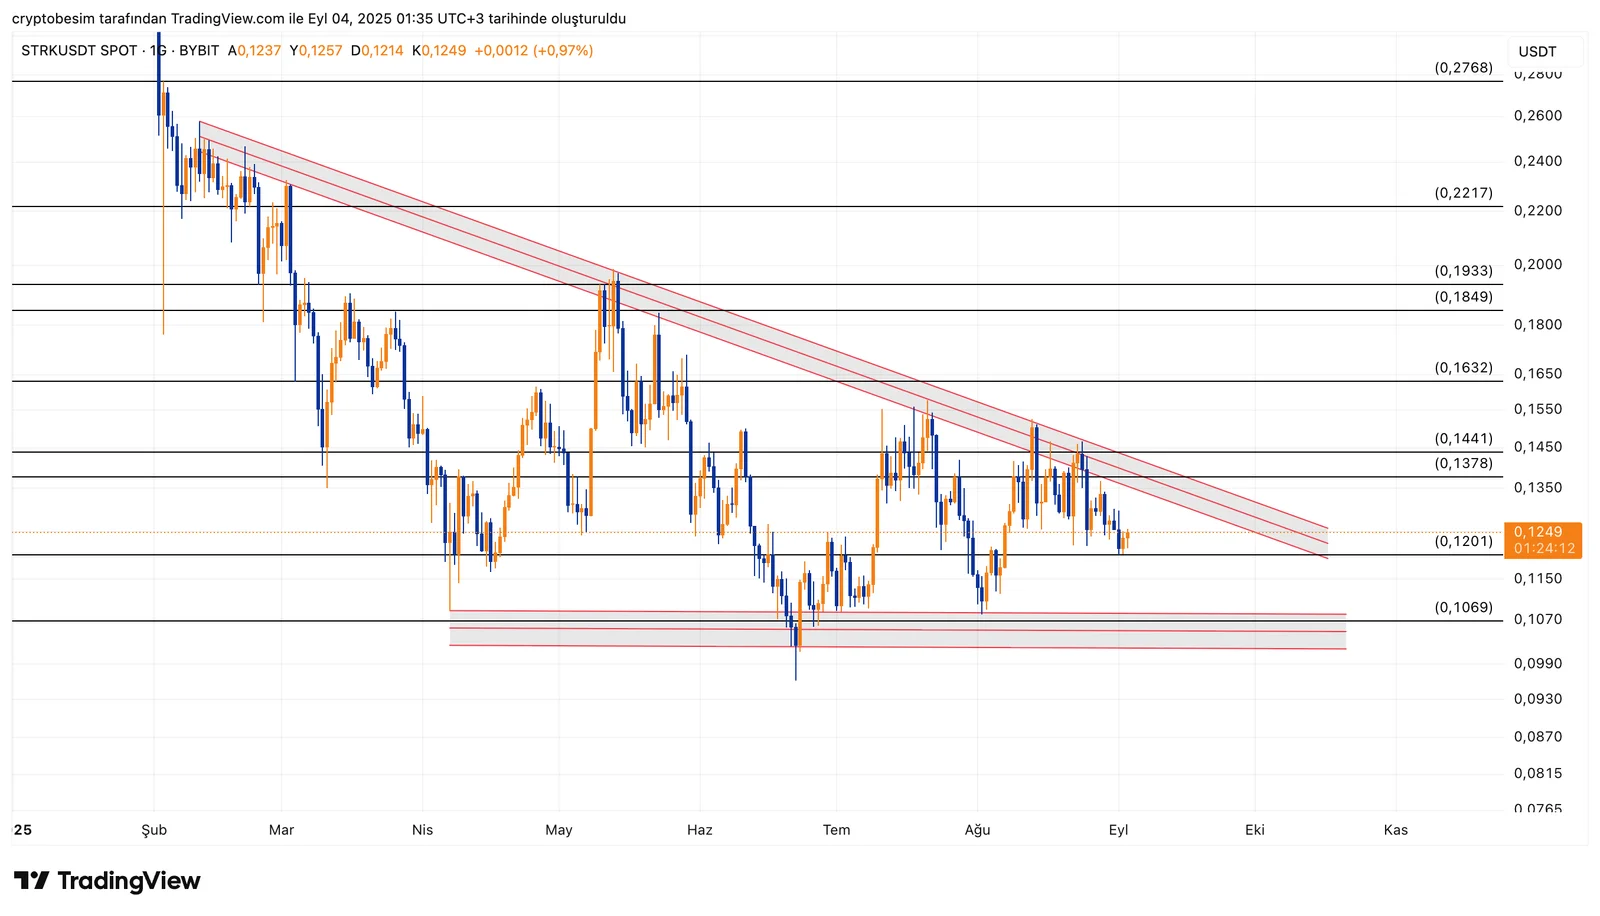
When we analyze the STRK chart, we can see a clear descending triangle pattern. The price has been trapped for a long time between a horizontal support from below and a descending trendline from above. Patterns like this often lead to sharp moves in the direction of the breakout.STRK is currently trading around the level $0.1249. The horizontal base of the triangle is near $0.1200 — a key support level. If the price closes below this level, the first target could be $0.1069, and further down, the $0.09 – $0.08 range may come into play.According to a bullish scenario, the first resistance levels are $0.1378 and $0.1441, aligning with the triangle's upper trendline. If the price holds above this range, it could test $0.1632 first, then move towards the $0.1849 – $0.1933 range. The technical target of the formation points to $0.22 and above.
Summary:
- Key support: $0.1200 (below this, risk at $0.1069)
- First resistance: $0.1378 – $0.1441
- Possible targets: $0.1632 → $0.1849 – $0.1933 → $0.2217Which way the descending triangle breaks will likely determine STRK’s medium-term trend.
This analysis is not financial advice. It focuses on potential support and resistance levels that may offer trading opportunities in the short to medium term. Trading and risk management are entirely the user’s responsibility. Using stop-loss orders is strongly recommended.


