
SOL/USDT Technical Overview
Analyzing the Solana chart, we observe a symmetrical triangle pattern, signaling that the price is being squeezed between a rising support line and a descending resistance line. Such formations often result in sharp breakout movements once the market picks a direction.
Currently, the price is around $200.77. The $195 level acts as both a short-term support and the lower boundary of the triangle. As long as the price holds above this area, the overall outlook remains positive. The next key resistance levels to watch are $219 and $227. A confirmed daily close above $227 could trigger a strong move toward $253 and potentially $295.
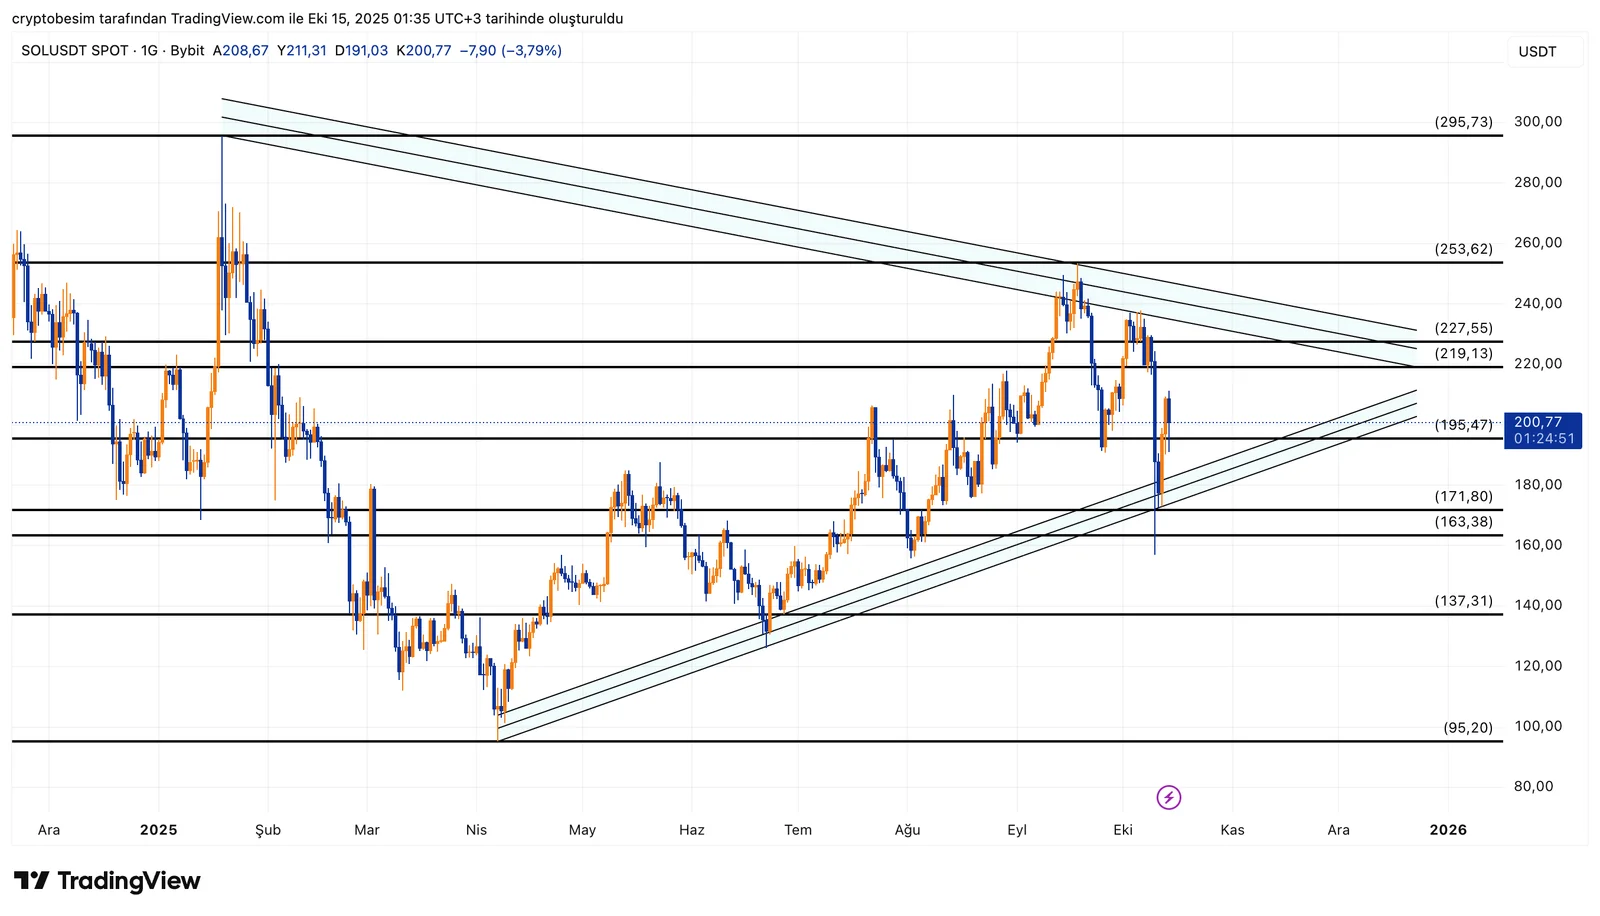
According to a bearish scenario, a daily close below $195 could increase selling pressure, with the next support zones at $171 and $163. However, the broader trend remains bullish, and there’s a higher probability of a test toward the upper band of the triangle in the near term.
Summary:
- SOL is consolidating within a symmetrical triangle.
- Current price: $200.77
- Support zone: $195
- Resistance zone: $219 – $227
- Above $227: Targets at $253 and $295
- Below $195: Supports at $171 and $163
- Watch for a rise in volume, as a breakout appears imminent.
These analyses, not offering any kind of investment advice, focus on support and resistance levels considered to offer trading opportunities in the short and medium term according to the market conditions. However, traders are responsible for their own actions and risk management. Moreover, it is highly recommended to use stop loss (SL) during trades.


