SHIB/USDT Technical Analysis
There has been some activity on the part of Shiba Inu again. More than 1.5 million wallets still hold SHIB, showing investors’ continued trust in the project, though the price has recently pulled back. Shibarium network activity is increasing at the same time, and token burns are reducing the total supply. This is a long-term positive signal.

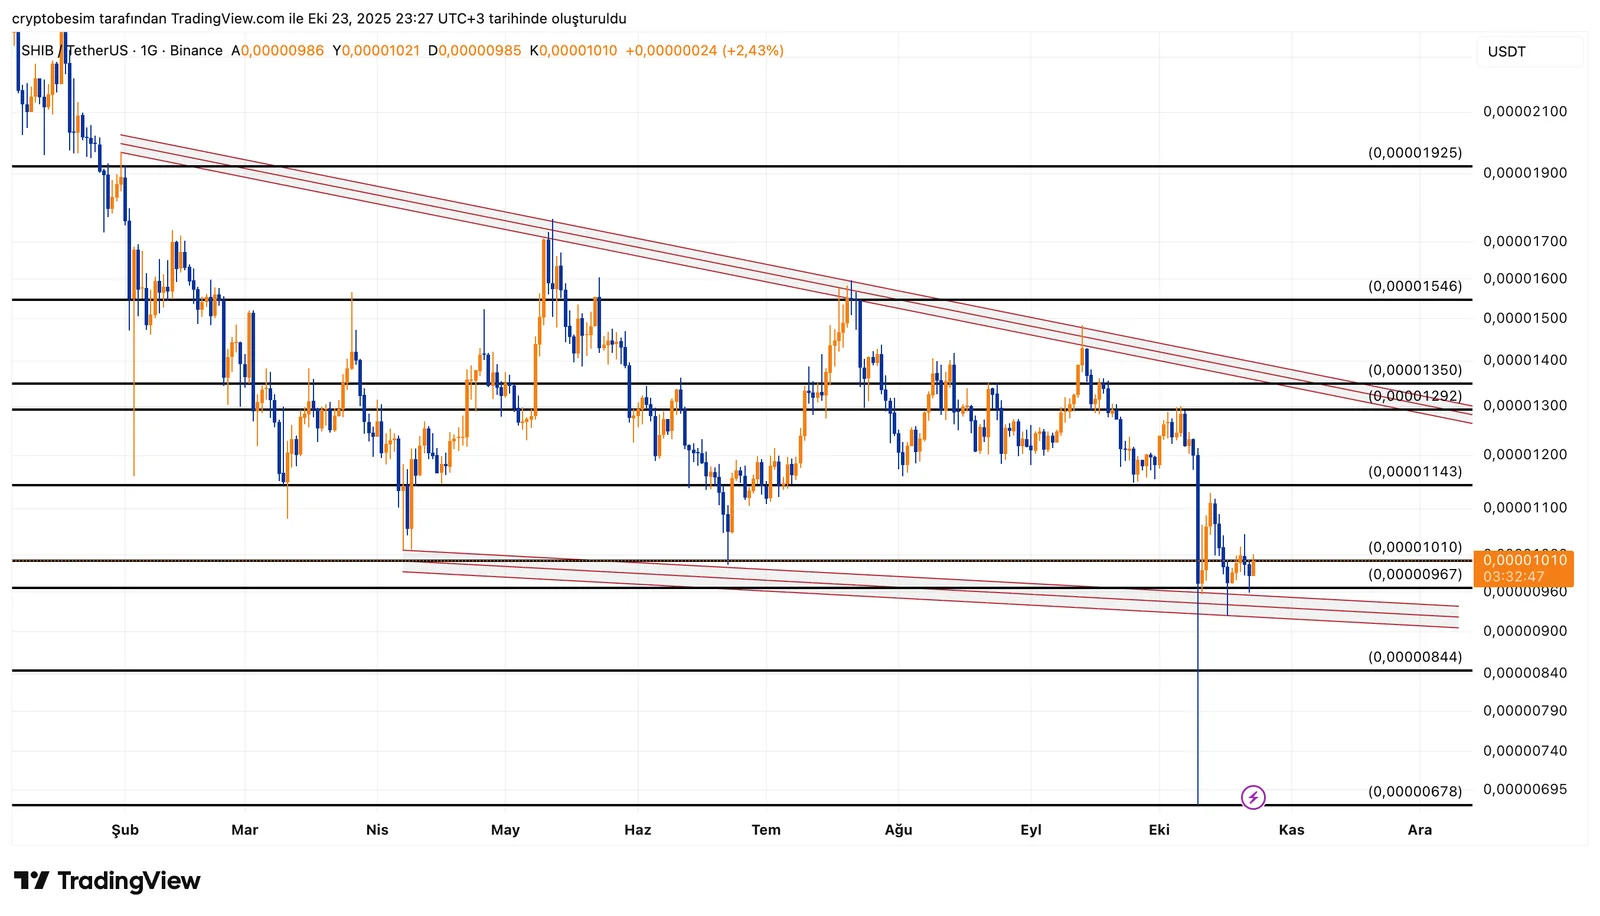
Analyzing the chart, we see that SHIB is moving inside a falling wedge pattern, signaling a potential bullish breakout. The price is currently around $0.00001010, holding near the strong support zone between $0.00000960 – $0.00000980. This area acts as both horizontal support and the bottom of the wedge, making it a key level for buyers.
We can see some liquidity wicks below, showing sellers are weakening while buyers are getting stronger. If SHIB continues to rise, it could target $0.00001290 – $0.00001350. A clear breakout above $0.00001350 may trigger a stronger move toward $0.00001546 and beyond.
Summary:
- SHIB is trading inside a falling wedge pattern.
- Strong support: $0.00000960 – $0.00000980.
- The pattern suggests a higher chance of an upward breakout.
- Support zones: $0.00000980 → $0.00000960 → $0.00000844.
- For confirmation, SHIB needs to stay above $0.00001350.
These analyses, not offering any kind of investment advice, focus on support and resistance levels considered to offer trading opportunities in the short and medium term according to the market conditions. However, traders are responsible for their own actions and risk management. Moreover, it is highly recommended to use stop loss (SL) during trades.


