
ID/USDT Technical Analysis
The ID chart has been moving inside a descending channel for a long time. Though the price has tested the upper band of the channel several times, no clear breakout has happened yet. Overall, the structure still shows that the price is in a downtrend.
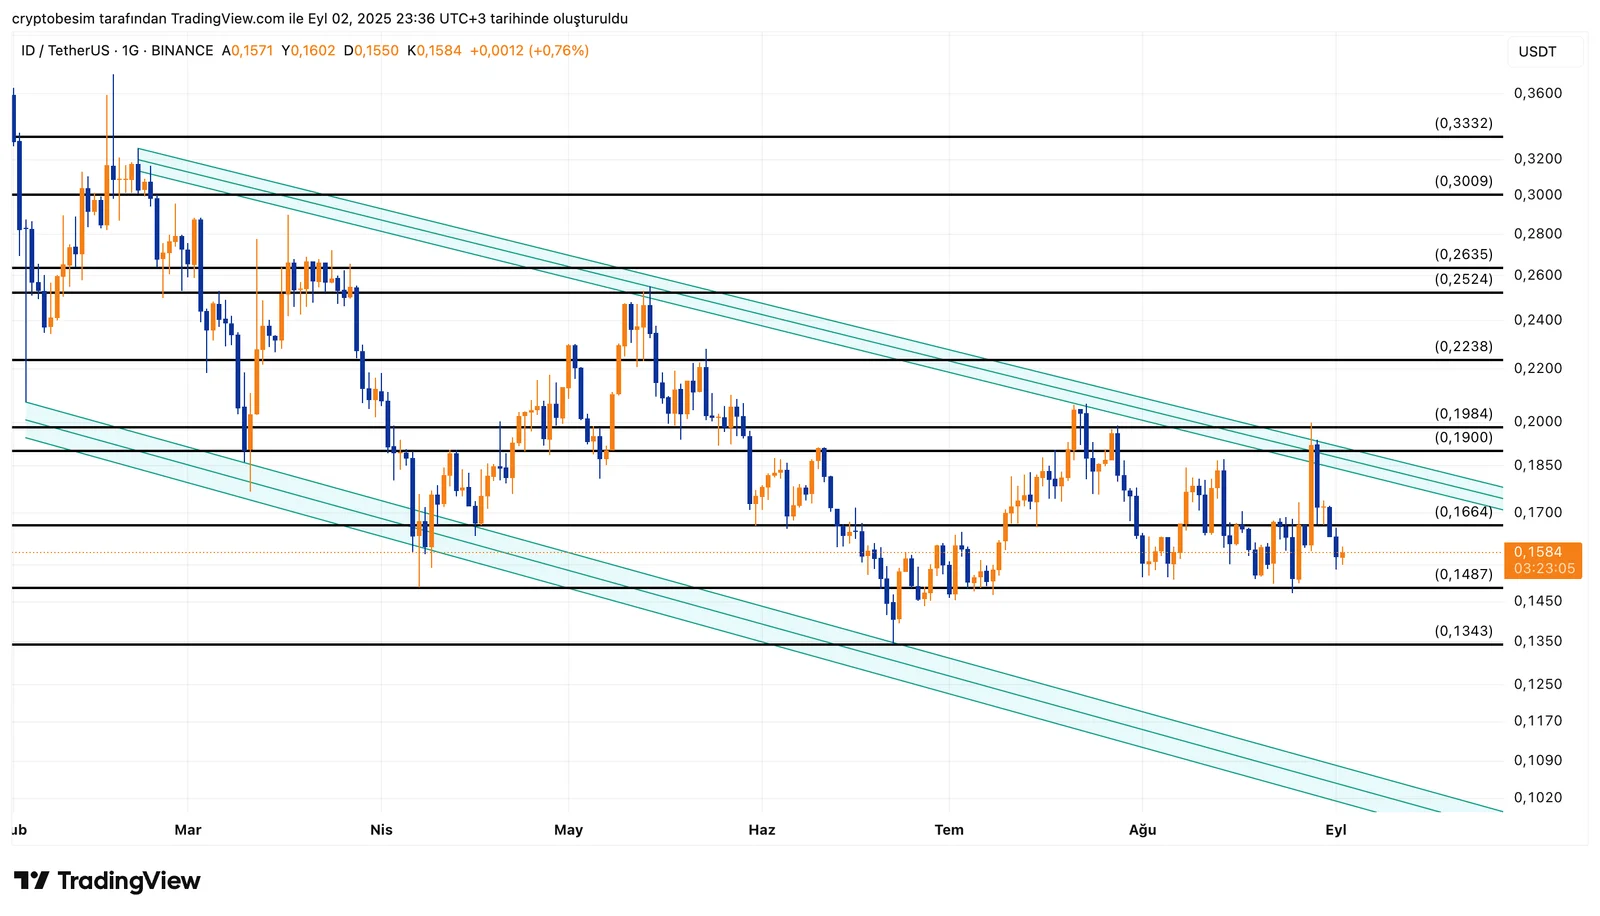
- Current price: $0.158
- Nearest resistance: $0.166
Bullish scenario:If the price holds above $0.166, it could move towards $0.190 – $0.198.Breaking this zone would increase the chance of an upside breakout from the channel.Next targets could be $0.223, and if the breakout is confirmed, the price may reach $0.30 – $0.36 (measured by channel height).
Bearish scenario:First support: $0.148Below that: $0.134 → $0.117 → $0.102Losing these levels could accelerate the downtrend.
Overall, the chart suggests that the probability of an upside breakout is higher.
These analyses, not offering any kind of investment advice, focus on support and resistance levels considered to offer trading opportunities in the short and medium term according to the market conditions. However, the user is responsible for their own actions and risk management. Moreover, it is highly recommended to use stop loss (SL) during the trades.


