
HYPE/USDT Technical Analysis
HYPE has become active again this year. The token has risen sharply in a short period and has seen a significant increase in trading volume. New features on the platform have made it easier for users to open positions across different markets, which has increased interest in HYPE.
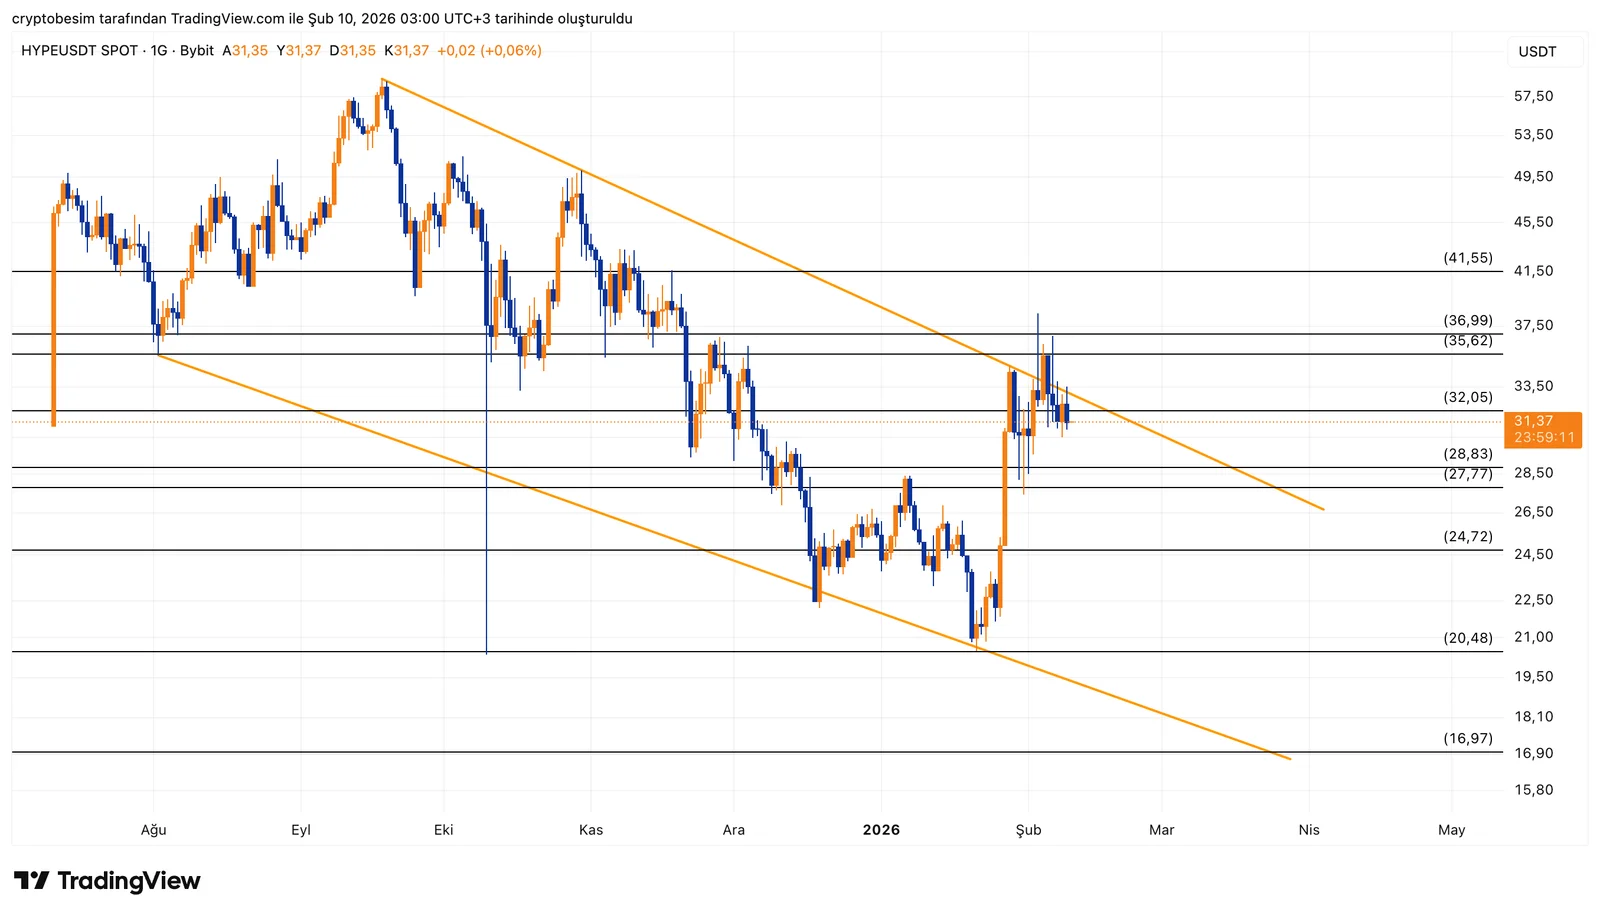
On the HYPE side, a falling wedge formation is clearly visible. A bullish breakout had previously occurred, but price failed to sustain it and moved back inside the wedge. This indicates that direction still needs confirmation in the short term.
In the current structure, the 27.77 – 28.83 range is a critical support zone.As long as price stays above this area, we can say that the breakout has not completely failed and that the possibility of another upside attempt remains valid.
In this scenario:
- Sustained price action above 28.83 → first 32.05, then the 35.62 – 36.99 range comes into play
- A renewed high-volume breakout above the wedge’s upper band would confirm a medium-term trend reversal
On the downside risk:
- Closes below 27.77 → positive structure breaks
In this case, price may pull back again toward the 24.72 and 20.48 support levels.
In summary:
- 27.77 – 28.83 is the short-term decision zone
- Above scenario: renewed wedge breakout and $32+
- Below scenario: formation invalidation and risk below $24
These analyses do not provide investment advice and focus on support and resistance levels that are considered to offer short- and medium-term trading opportunities depending on market conditions. However, responsibility for execution and risk management lies entirely with the user. In addition, the use of stop loss is strongly recommended.


