
Ethereum Technical Analysis (May 5, 2025): Long and Medium-Term Outlook Ahead of the Pectra Upgrade
1) Long-Term (1W) Chart Analysis: Positive Compression at Structural Supports
On the weekly chart, Ethereum appears to have broken below the main ascending trendline (and even the parallel channel structure) that began in March 2020. After the trend breakdown at the 2350 level, the price retraced to the 1800–1700 range, which can be interpreted as a macro-level S/R Flip and POI test.The most striking detail is that the price turned upwards before reaching the very high-volume demand block located in the 1234 to 1041 dollar range, coming from previous bear market lows. This indicates that market participants are buying again at higher levels and positioning for a trend reversal without the need for deep sell-offs.
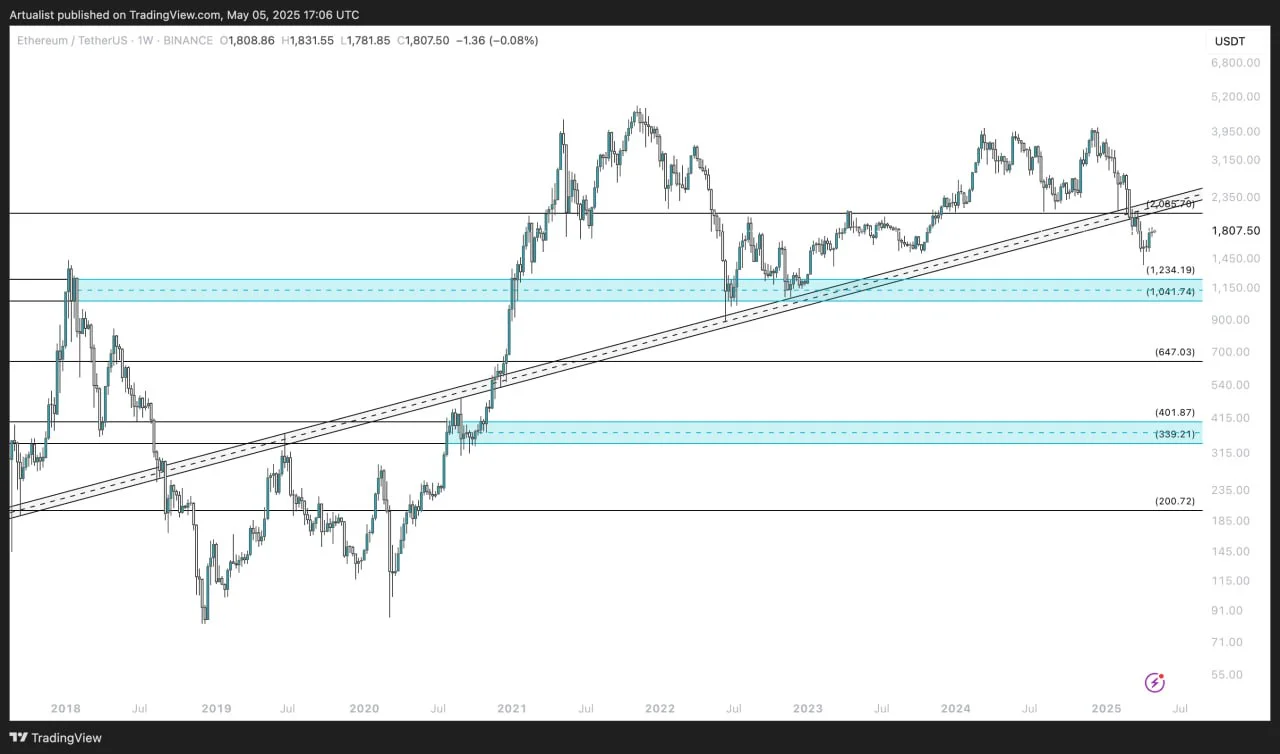
When analyzed on a weekly basis, Ethereum’s:
- 1,800 USDT level is currently the main short-term defended level.
- The 2,085 – 2,350 range is the resistance zone where weekly liquidity is clustered and the first area the price will aim to reach.
- 1,740 is the last line of defense; below it, weekly POIs come into play.
The weekly structure shows that despite short-term declines, ETH is still preparing for a medium-term uptrend.
2) Short-Term (1D) Chart Analysis: Microstructure Liquidity Sweep and Recovery
On the daily chart, during the drop starting from the 2100 level, the price first broke the S/R Flip zone around the 2000–2100 range, then pulled back to the micro POI located at 1740. This zone is also an area where liquidity had accumulated in the past and strong buys took place, and the current price behavior shows a new upward structure is being built from this zone.
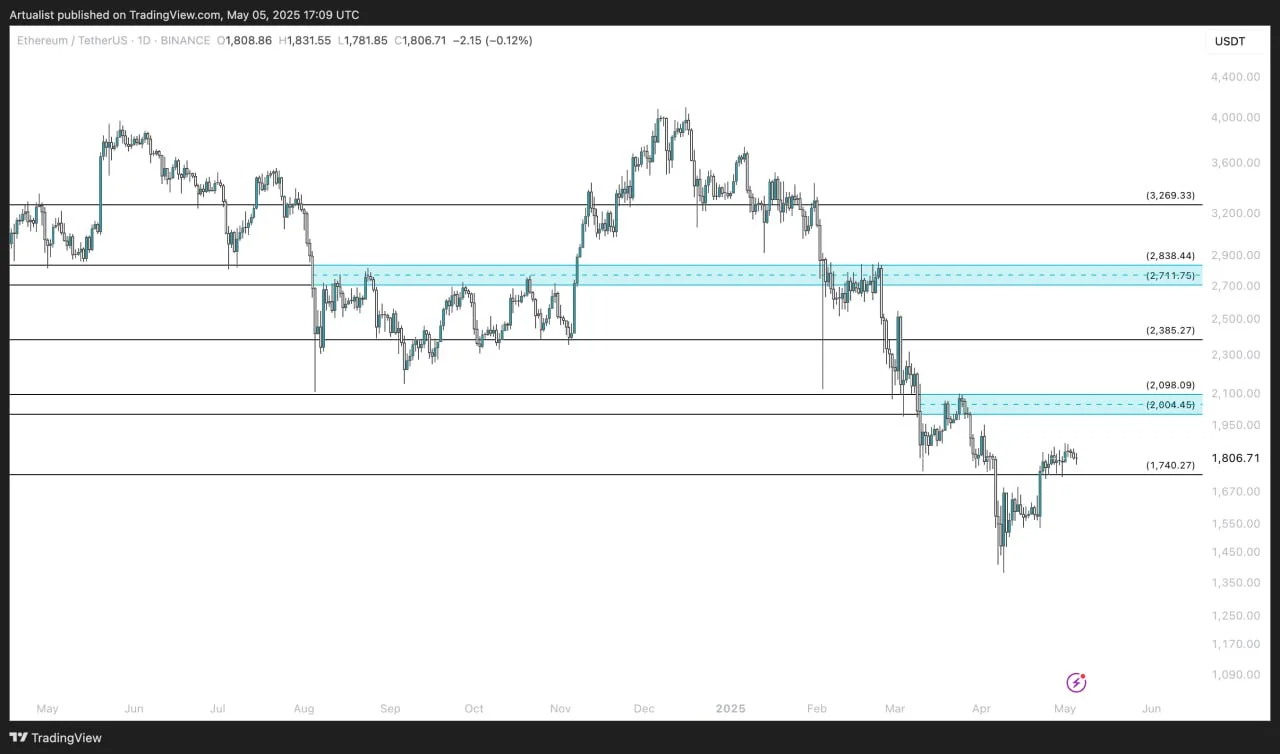
This structure indicates that ETH is preparing for a “secondary upward wave” and is repositioning toward upper liquidity areas.
Pectra Upgrade and FOMC Meeting Creating Synergy
Both long- and short-term charts suggest that Ethereum may have completed its bearish structure and is technically laying the groundwork for an upward reversal. At this point, two major events could act as macro triggers and accelerate a bullish breakout:
FOMC (May 7, 2025): The Fed holding rates steady is almost priced in. However, the tone Powell adopts (e.g., signaling more patience against rising inflation) could lead to a sudden liquidity inflow into risk assets. Assets like ETH could directly benefit from this. Especially short-term closes above 2100 would confirm Ethereum’s “macro reversal” signal.
Pectra Upgrade: Ethereum’s Pectra upgrade, set to go live in mid-2025, will increase validator efficiency, accelerate Layer 2 integrations, and improve gas optimization. This implies a significant improvement in on-chain usage metrics. As with previous upgrades (e.g., Merge and Shanghai), such structural developments create delayed but strong impacts on price.
The long-term positive expectation created by Pectra makes investors more resistant to short-term FUD. This enhances ETH’s resilience to downward pressure and increases the strength of upward reactions. As a result, when all structures are considered together, in Ethereum:
- 1) In the short term, the 2,000–2,100 zone will be retested.2) If sustained movement occurs above this region, a rally toward 2,385 and 2,741 can be expected.3) With the effect of the Pectra upgrade, the 3,269 level may become a target as summer approaches.
Short-term closes below 1,740 may trigger drops toward 1,234, but this is not the main scenario.


