
EDU/USDT Technical Analysis
The EDU chart still shows a symmetrical triangle pattern on the daily timeframe. Price is moving between the falling resistance line above and the rising support line below. This structure usually signals strong moves once a breakout happens.
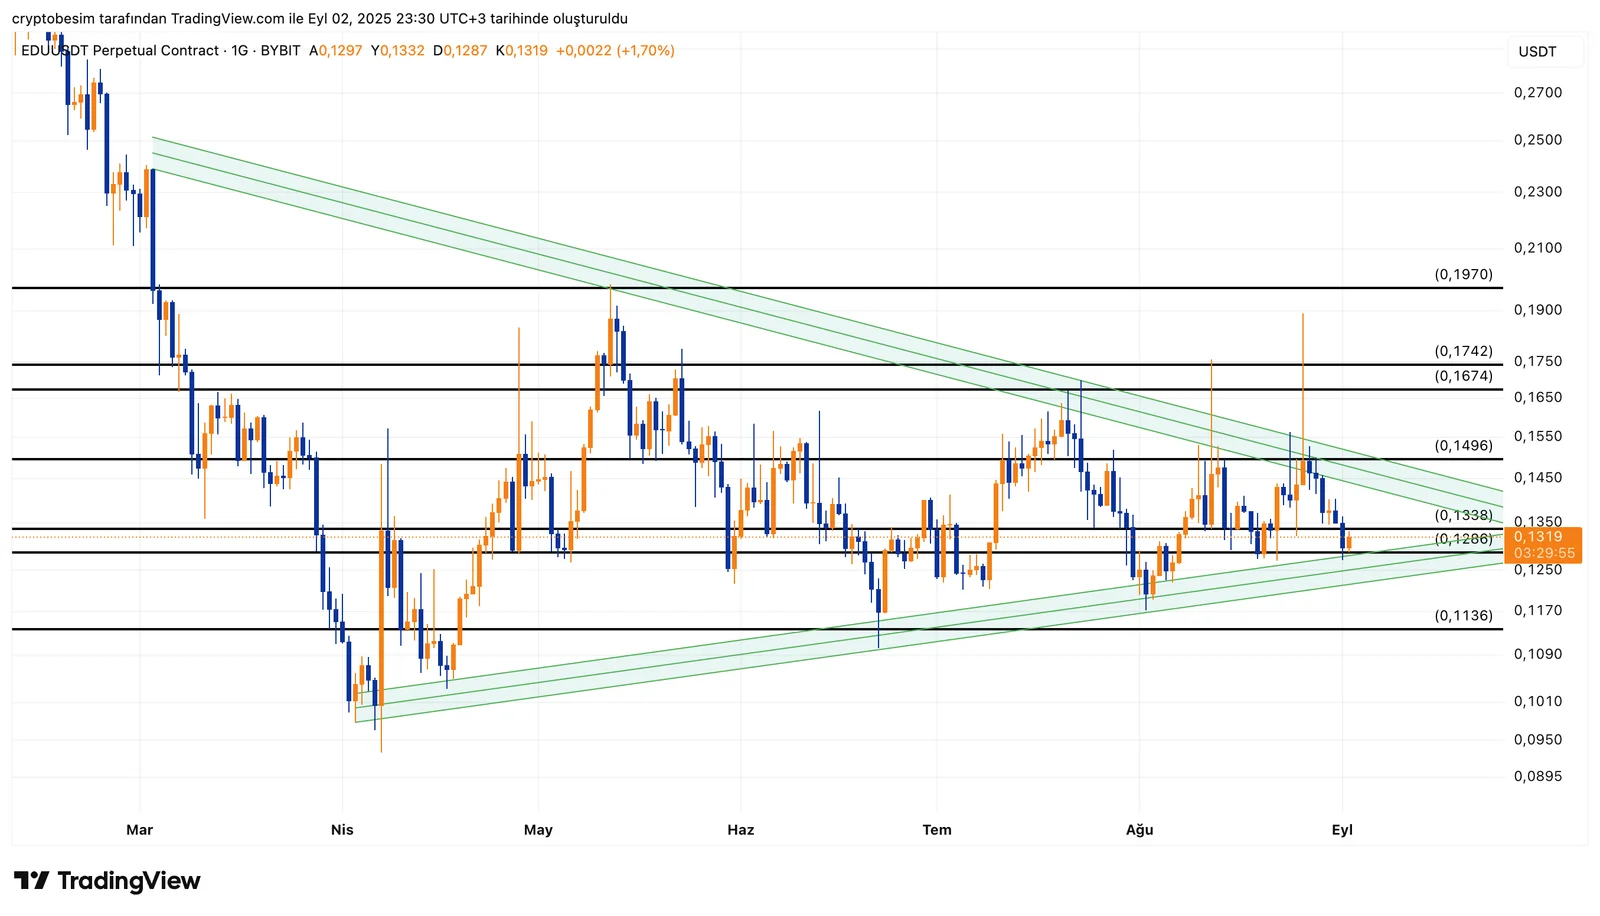
- Current Price: $0.1319
- Triangle middle support: $0.1286 (price is trying to hold above this)
- Key Resistance: $0.1338 (upper band of the triangle)
Bullish Scenario:
If price breaks and holds above $0.1338, momentum could increase.
- First target: $0.1496
- Next targets: $0.1674 – $0.1742
- If broken, price could extend to $0.1970
- Medium-term triangle target: $0.24
Bearish Scenario:If price loses support:
- First support: $0.1286
- Next supports: $0.1200 → $0.1136
- If broken, price could fall to $0.10
The symmetrical triangle is still valid, so traders should watch closely for breakout direction.
These analyses, not offering any kind of investment advice, focus on support and resistance levels considered to offer trading opportunities in the short and medium term according to the market conditions. However, the user is responsible for their own actions and risk management. Moreover, it is highly recommended to use stop loss (SL) during the trades.


