
EDU Technical Analysis
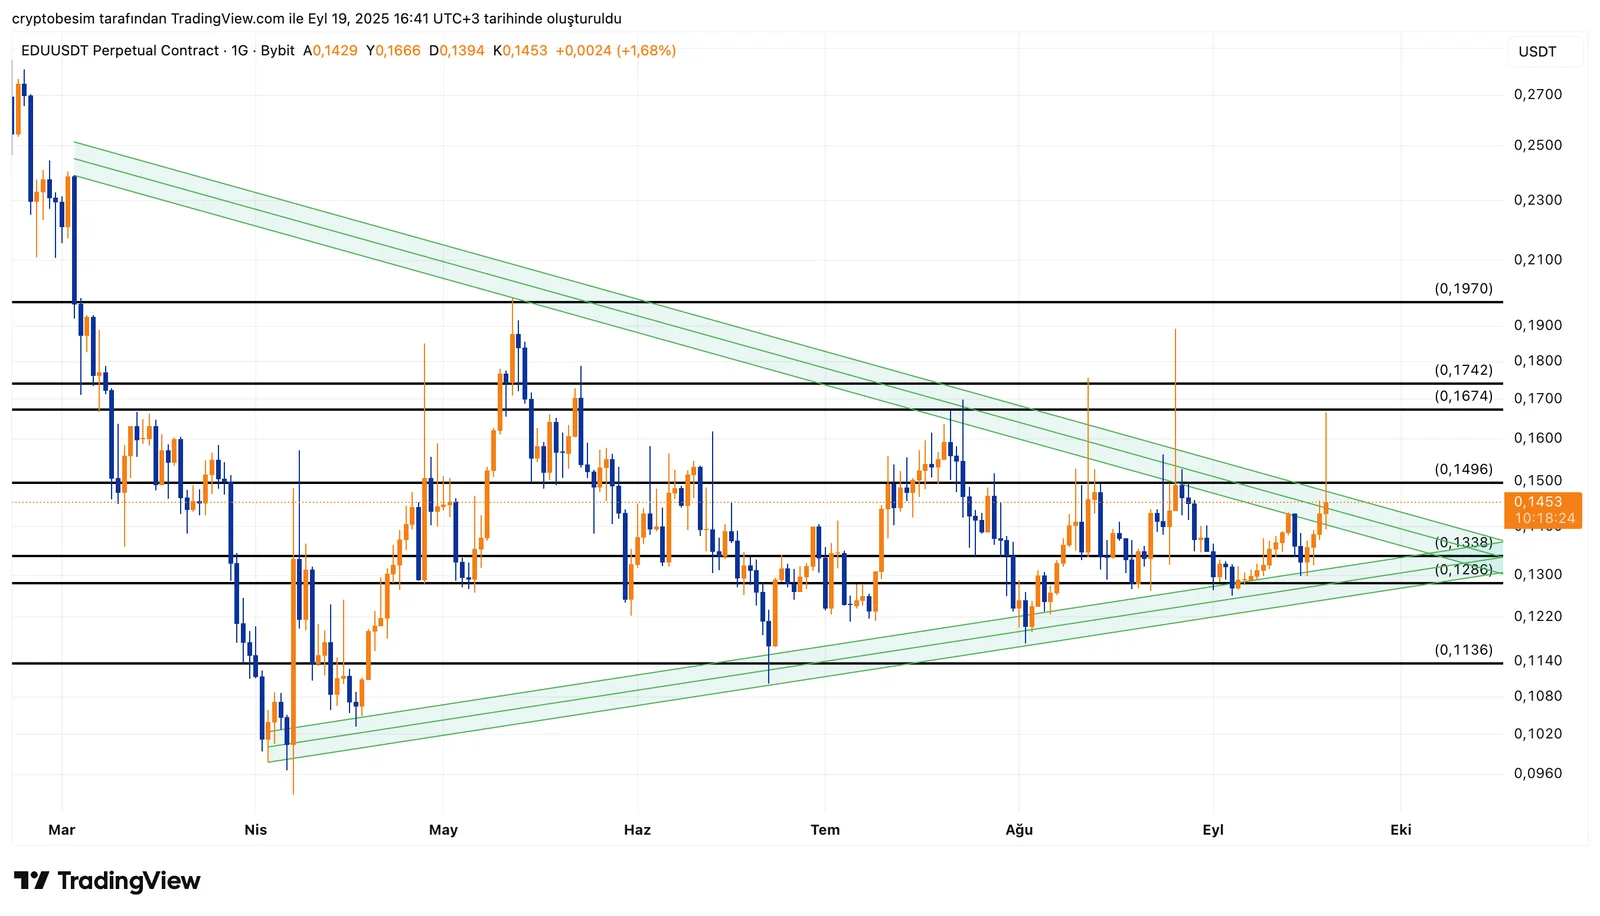
When we analyze the EDU chart, we see that the symmetrical triangle formation is still valid. The price of the coin initiated an upward move with the support it got from the lower border of the triangle. The price is currently trading around the level $0.1453, close to the mid-upper border of the triangle. This region is crucial in terms of the upward breakout of the price.
The upper border of the triangle formation — $0.1496 — stands as a strong resistance in the short term. A new rally toward the range $0.1674–$0.1724 could start if the price manages to close above this resistance. Moreover, if the price can break out here, the first target will be the level $0.1970 followed by the mid-term target at $0.24.
According to a bearish scenario, the support levels to follow are $0.1338, followed by $0.1286 and $0.1136. Below these support levels, the drop in the price could speed up and a pullback to the level $0.10 might be on the table.
Summary:
- Current price: $0.1453
- Holding above $0.1496, the possible targets are $0.1674–$0.1742 and $0.1970
- Below the levels $0.1338 and $0.1286, expect more drop.
These analyses, not offering any kind of investment advice, focus on support and resistance levels considered to offer trading opportunities in the short and medium term according to the market conditions. However, traders are responsible for their own actions and risk management. Moreover, it is highly recommended to use stop loss (SL) during trades.


