
BTC Technical Analysis
Today’s developments along the U.S.–Israel–Iran axis were directly reflected in BTC price action. Risk appetite declined and market participants stepped back. In periods like this, panic can accelerate quickly, but the real direction is still defined by where price holds.
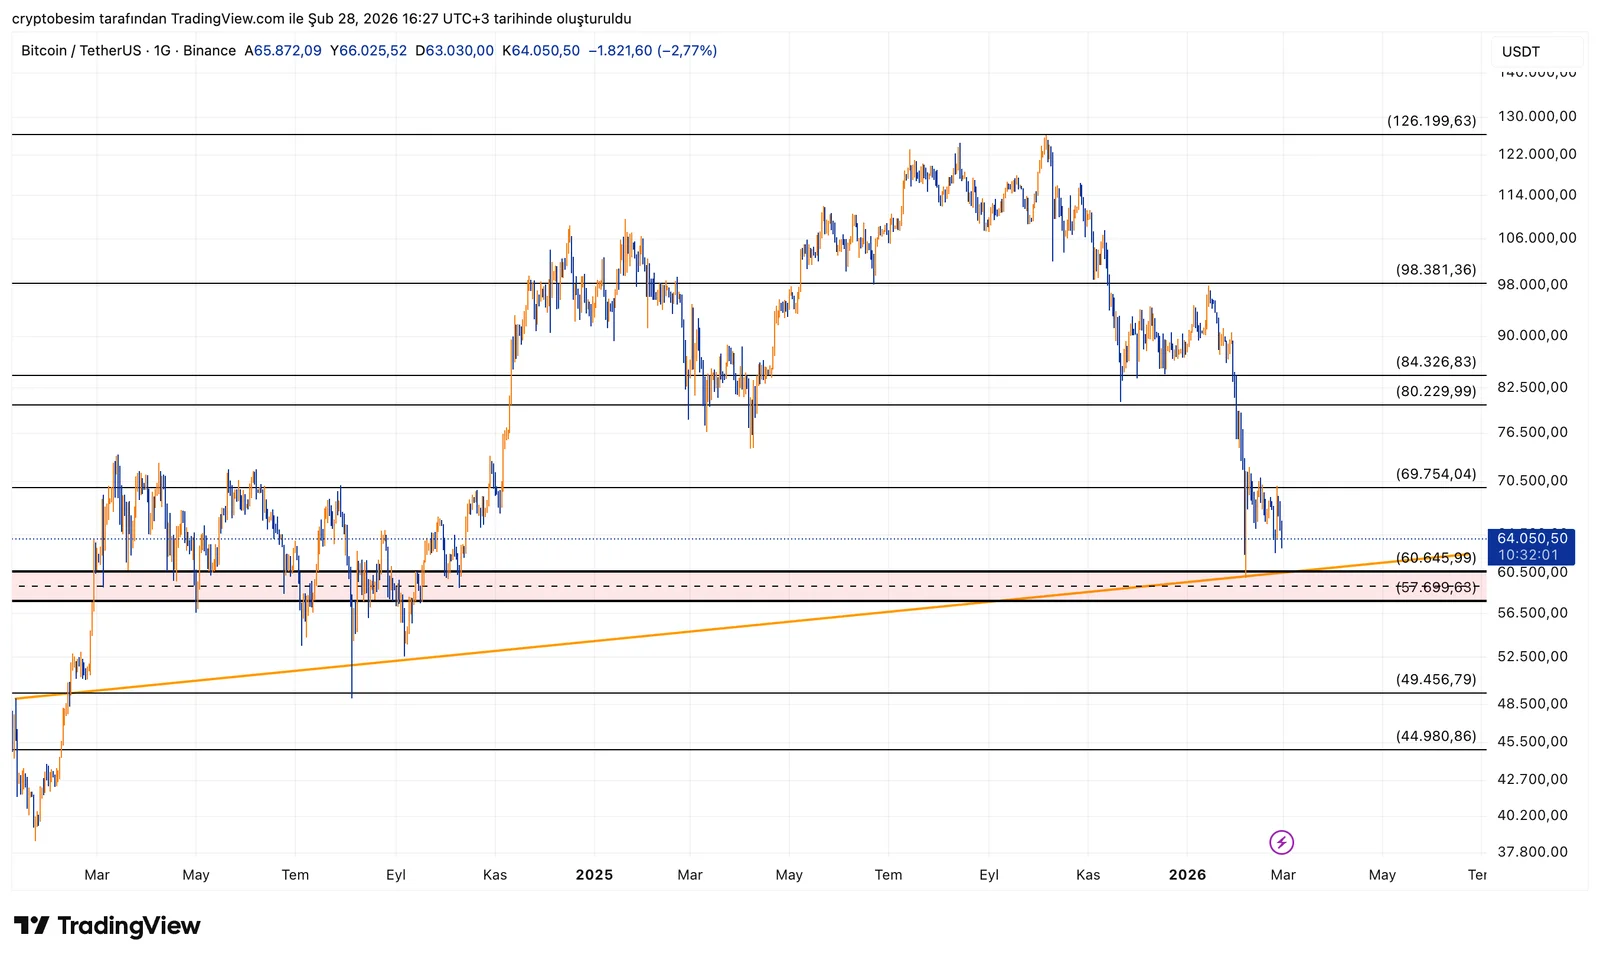
The key zone right now is the 60,000 – 57,700 dollar band. This area previously attracted buyers and also aligns with the long-standing ascending structure on the chart. Price is currently trading around 64,000, yet downside pressure is clearly present.
If price continues to hold above 60,000, the market may begin to stabilize. In that case, a recovery toward the 69,700 region would not be surprising. Without reclaiming that level, strong bullish momentum is unlikely, but at least short-term relief could emerge.
The critical level remains 57,700. A breakdown below this zone could accelerate selling pressure. Under such a scenario, sharp wicks toward the 49,000 area would not be unexpected. Similar geopolitical tension periods in the past produced comparable moves followed by reactions.
At this stage, the focus should not be on predicting direction but on monitoring how the 57,700 – 60,000 range is defended. If news flow intensifies, volatility will likely increase. If the zone holds, the market may attempt to recover. A loss of this band would significantly weaken the structure.
These analyses do not provide investment advice and focus on support and resistance levels that are considered to offer short- and medium-term trading opportunities depending on market conditions. However, responsibility for execution and risk management lies entirely with the user. In addition, the use of stop loss is strongly recommended.


