
BTC Technical Analysis
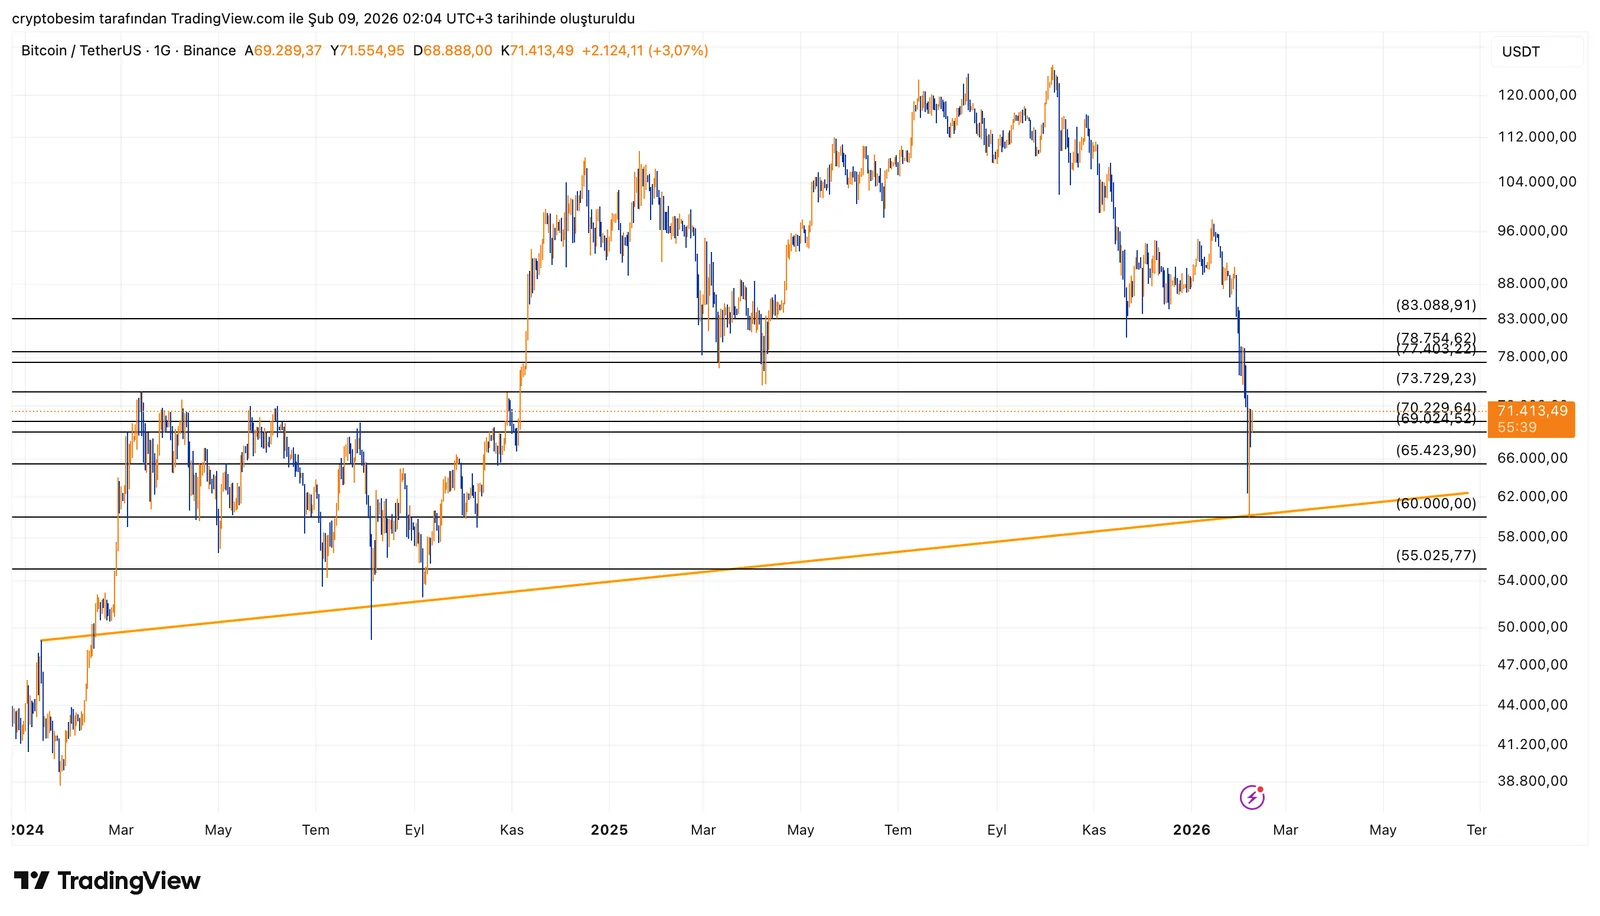
On the BTC side, the $69,000 – $70,000 range is clearly a critical support zone. The fact that this area has previously acted as a horizontal level and that the rebound after the recent decline has held above this zone helps preserve the short-term structure.
As long as price remains above this band, an initial test of the $73,700 – $75,000 range is expected, followed by a continuation toward the $77,000 – $78,000 area. Especially the $77,000 – $78,000 zone is a likely area for profit-taking, as it represents both a previous breakout region and a strong supply zone.
In the downside scenario, closes below $69,000 weaken the structure. In this case, $65,400 and then the main trend support at $60,000 come into focus, respectively.
In summary:
- Above $69,000 – $70,000 → structure remains intact
- Targets: $73,700 → $77,000 – $78,000
- $77,000 – $78,000 → profit-taking zone
- Below $69,000 → risk toward $65,400 / $60,000
These analyses do not provide investment advice and focus on support and resistance levels that are considered to offer short- and medium-term trading opportunities depending on market conditions. However, responsibility for execution and risk management lies entirely with the user. In addition, the use of stop loss is strongly recommended for all shared trades.


