
BTC Technical Analysis
Analyzing BTC chart on a daily time frame, we see that the coin managed to complete an Inverse Head & Shoulders formation which has been forming for nearly seven months – from early 2025 till early July. BTC surged to a new ATH at $123K after it broke out of the neckline area (grey zone) with strong volume. The price of the coin saw a healthy retest to the neckline zone following the breakout, and this move confirmed this region as a support zone.
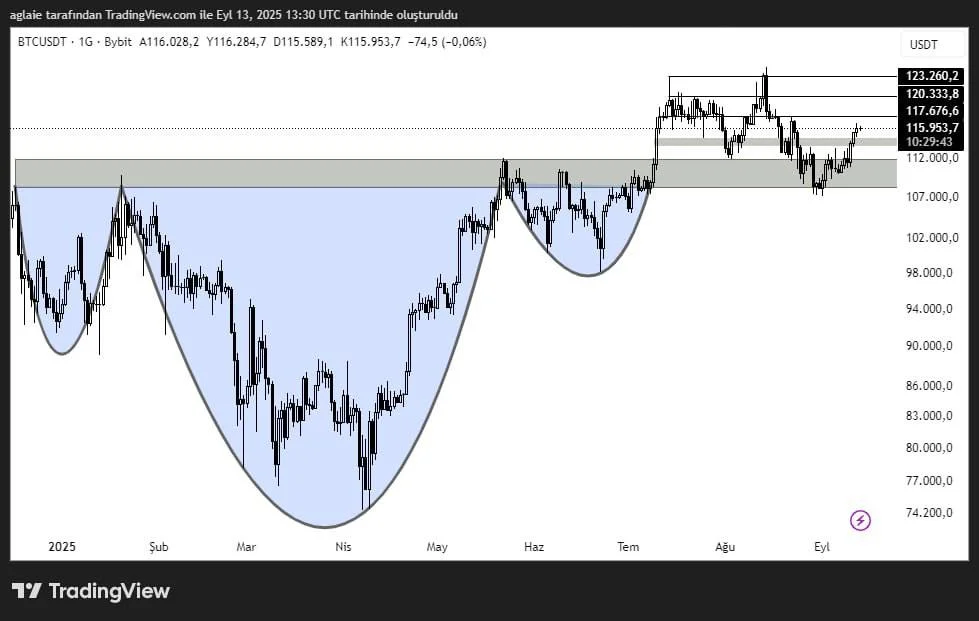
BTC started another rally from here, and we see that $117.6K, $120.3K, and the previous ATH at $123K currently stand as key resistance levels in the short term. It is likely that BTC will see some profit-taking before it moves on.
Providing that BTC sees daily closings above $123K with strong volume, it could test $130K first, and then potentially $150K.
According to a bearish scenario, BTC might go down to test $112K–$113K, and $108K in case of a deeper correction.
If we summarize the scenario, we can say that the completion of the Inverse Head & Shoulders formation marks the start of a major bull phase for BTC. A potential Fed rate cut on September 17th and daily price closings above $123K could end up with the start of the second phase of the bull market, the Ethereum rally. As ETH/BTC chart rises, we can expect a broader altcoin season.
These analyses, not offering any kind of investment advice, focus on support and resistance levels considered to offer trading opportunities in the short and medium term according to the market conditions. However, traders are responsible for their own actions and risk management. Moreover, it is highly recommended to use stop loss (SL) during trades.


