
BTC Technical Analysis
This week, a key development is taking place for BTC: approximately $17 billion worth of BTC and ETH options are set to expire. This could bring significant liquidity shifts and define the next market direction.
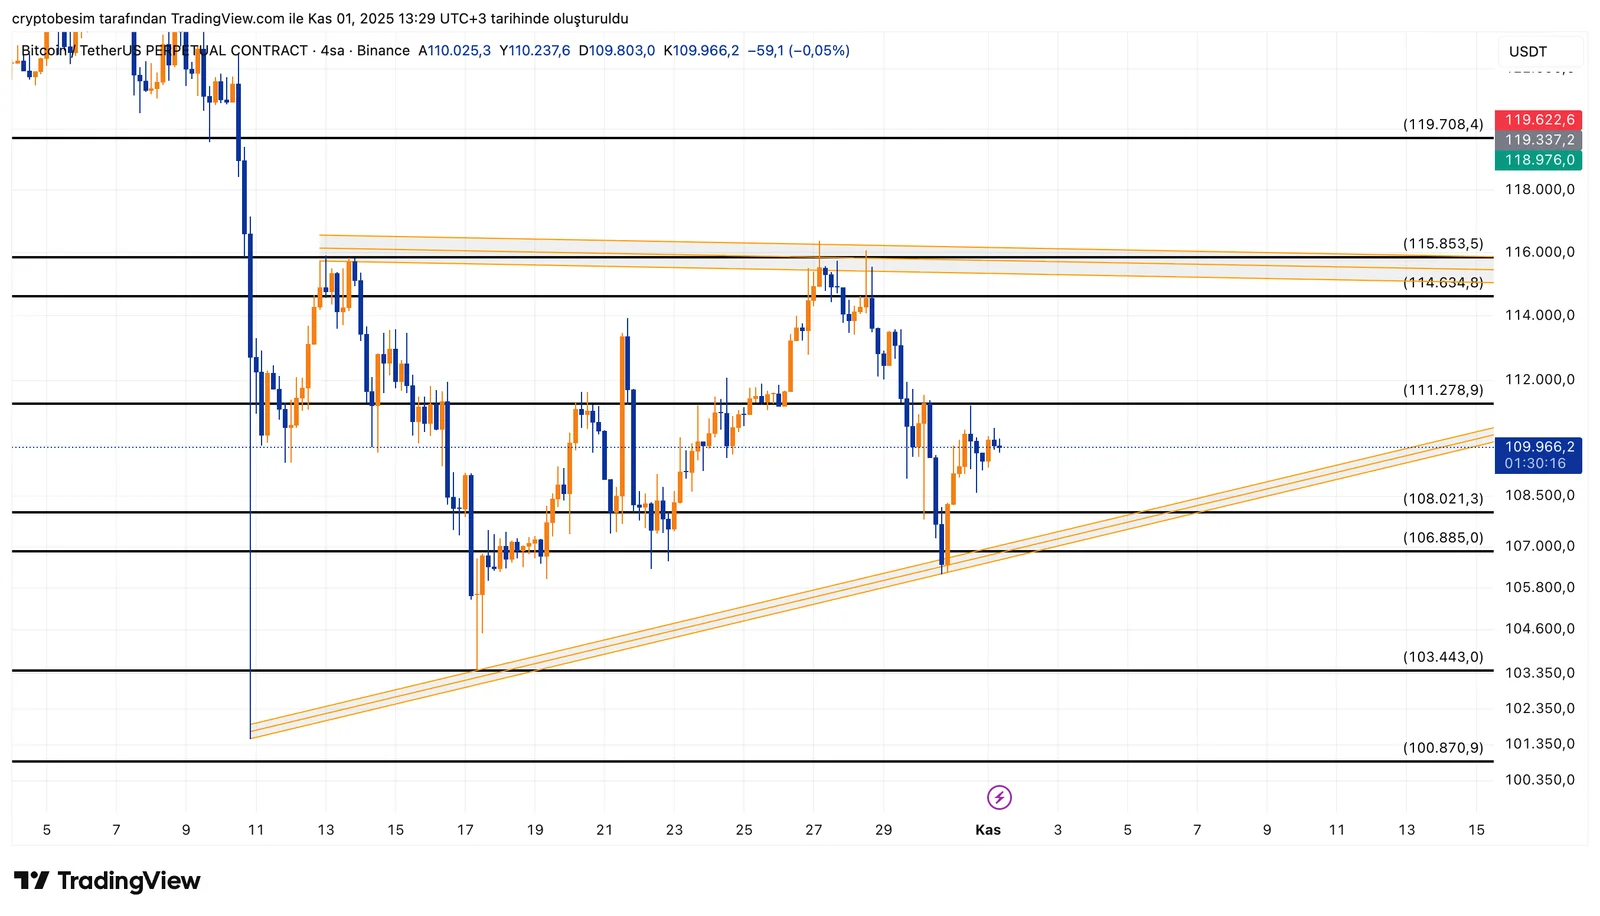
Following the dump on October 10, BTC has been consolidating in a sideways range, forming a rising triangle pattern. The price is currently stabilizing around $109,000–$110,000, holding above the triangle’s ascending trendline — which indicates that buyers are gaining control.
The upper boundary of the triangle sits at $114,000–$115,000. A strong breakout above this zone could trigger the pattern’s target and confirm a new uptrend, with an initial move expected toward $119,500.
On the other hand, the $108,000–$106,800 area acts as the first support zone. If this is lost, BTC could pull back toward $103,400. However, the current structure still favors an upward breakout, supported by rising lows and tightening price action.
Support and Resistance Levels
- Support: $108,000 – $106,800 – $103,400 – $100,900
- Resistance: $111,300 – $114,000 – $115,000 – $119,500
Summary:
- BTC has formed a rising triangle within a range.
- A breakout above $114K–$115K would likely spark a strong rally.
- Higher lows show growing buyer strength.
- Below $108K, short-term weakness could appear.
These analyses, not offering any kind of investment advice, focus on support and resistance levels considered to offer trading opportunities in the short and medium term according to the market conditions. However, the user is responsible for their own actions and risk management. Moreover, it is highly recommended to use stop loss (SL) during the transactions.


