
APT Technical Analysis
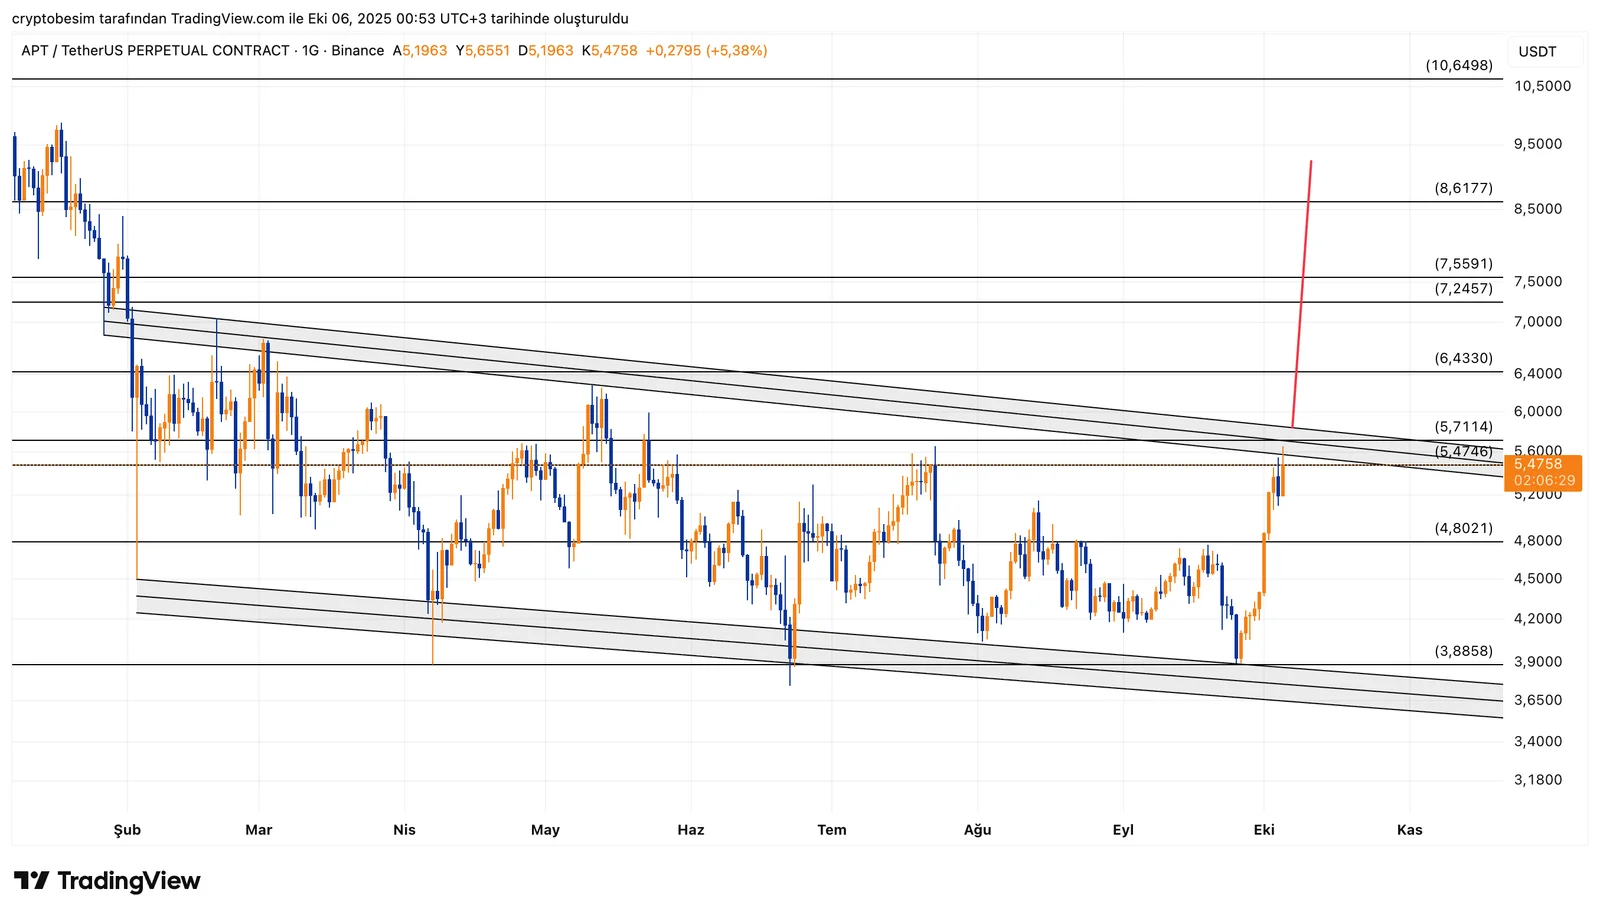
When we analyze the APT chart, we can see that the coin has continued to trade within a descending channel for some time. Recently, the price tested the upper boundary of the channel again but encountered strong resistance.
APT is currently trading around $5.47, and the potential for an upside breakout is increasing. The zone between $5.71 and $5.80 marks the upper boundary of the channel, and a daily close above this range would confirm a breakout. Based on the height of the channel, the medium-term technical target in the case of a breakout could be around $9.00.
On the downside, the area between $4.80 and $3.88 stands as the main support zone. The price must stay above this area for the bullish scenario to remain valid. However, daily closes below $4.80 may weaken the current setup and increase the risk of a deeper correction.
Key levels to follow:Resistance levels: $5.71 → $5.80 → $9.00Support levels: $4.80 → $3.88
These analyses, not offering any kind of investment advice, focus on support and resistance levels considered to offer trading opportunities in the short and medium term according to the market conditions. However, traders are responsible for their own actions and risk management. Moreover, it is highly recommended to use stop loss (SL) during trades.


