
ADA/USDT Technical Analysis
Thanks to rising on-chain activity and strong whale buying, Cardano (ADA) has recently gained renewed attention. Expectations around a possible spot ADA ETF in the U.S., along with accumulation by large wallets, have further increased investor interest. With these developments, the technical outlook for ADA has become even more significant.
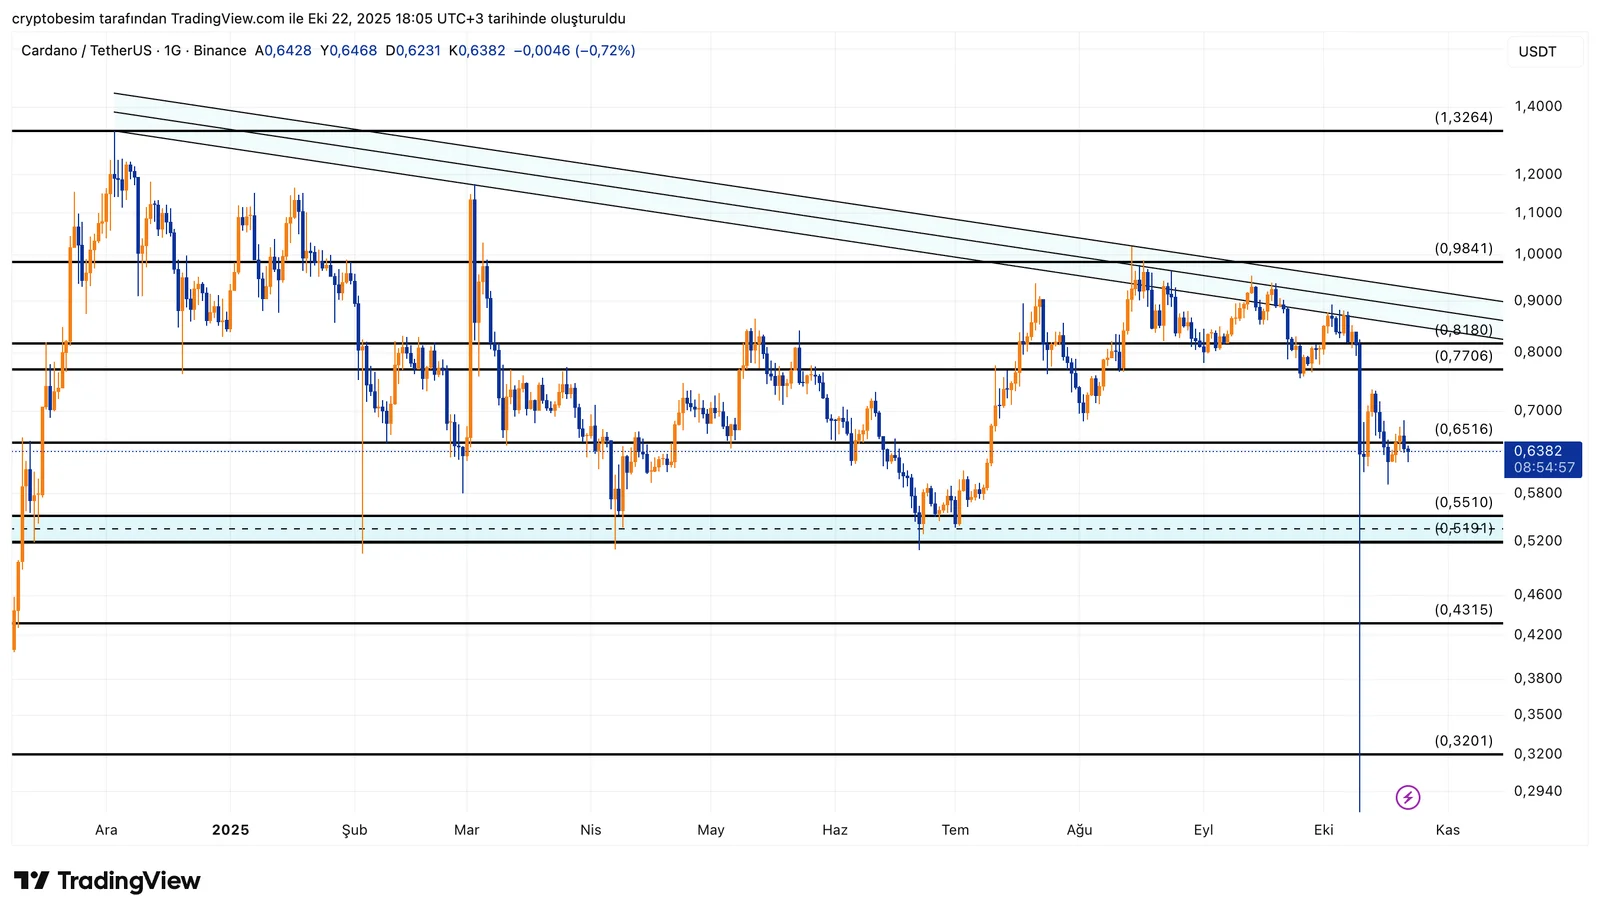
Analyzing the chart, we see that ADA is forming a descending triangle pattern. The coin has been trying to hold above the $0.55–$0.59 support zone, but downward pressure remains visible. The pattern shows that ADA is approaching a decision point, where a breakout is likely to occur soon.
ADA is currently trading around $0.6382. The first resistance is at $0.6516. If the price can hold above this level, it may move toward the upper trendline of the triangle and test the $0.77–$0.82 region. This area is critical as it aligns with the main descending trendline.
In a bearish scenario, the $0.5919–$0.5510 zone is the key support area, which has held multiple times in the past. However, if this zone breaks, selling pressure could intensify, pushing the price down toward $0.43.
Summary:
- ADA is still moving within a descending triangle pattern.
- Current price: $0.6382
- A move above $0.6516 could target $0.7706 → $0.8180
- The $0.5919–$0.5510 zone remains the main support
- A daily close below $0.55 could trigger a deeper pullback toward $0.43
- A strong breakout in either direction may result in sharp and fast price action.
These analyses, not offering any kind of investment advice, focus on support and resistance levels considered to offer trading opportunities in the short and medium term according to the market conditions. However, traders are responsible for their own actions and risk management. Moreover, it is highly recommended to use stop loss (SL) during trades.


