
AAVE/USDT Technical Outlook
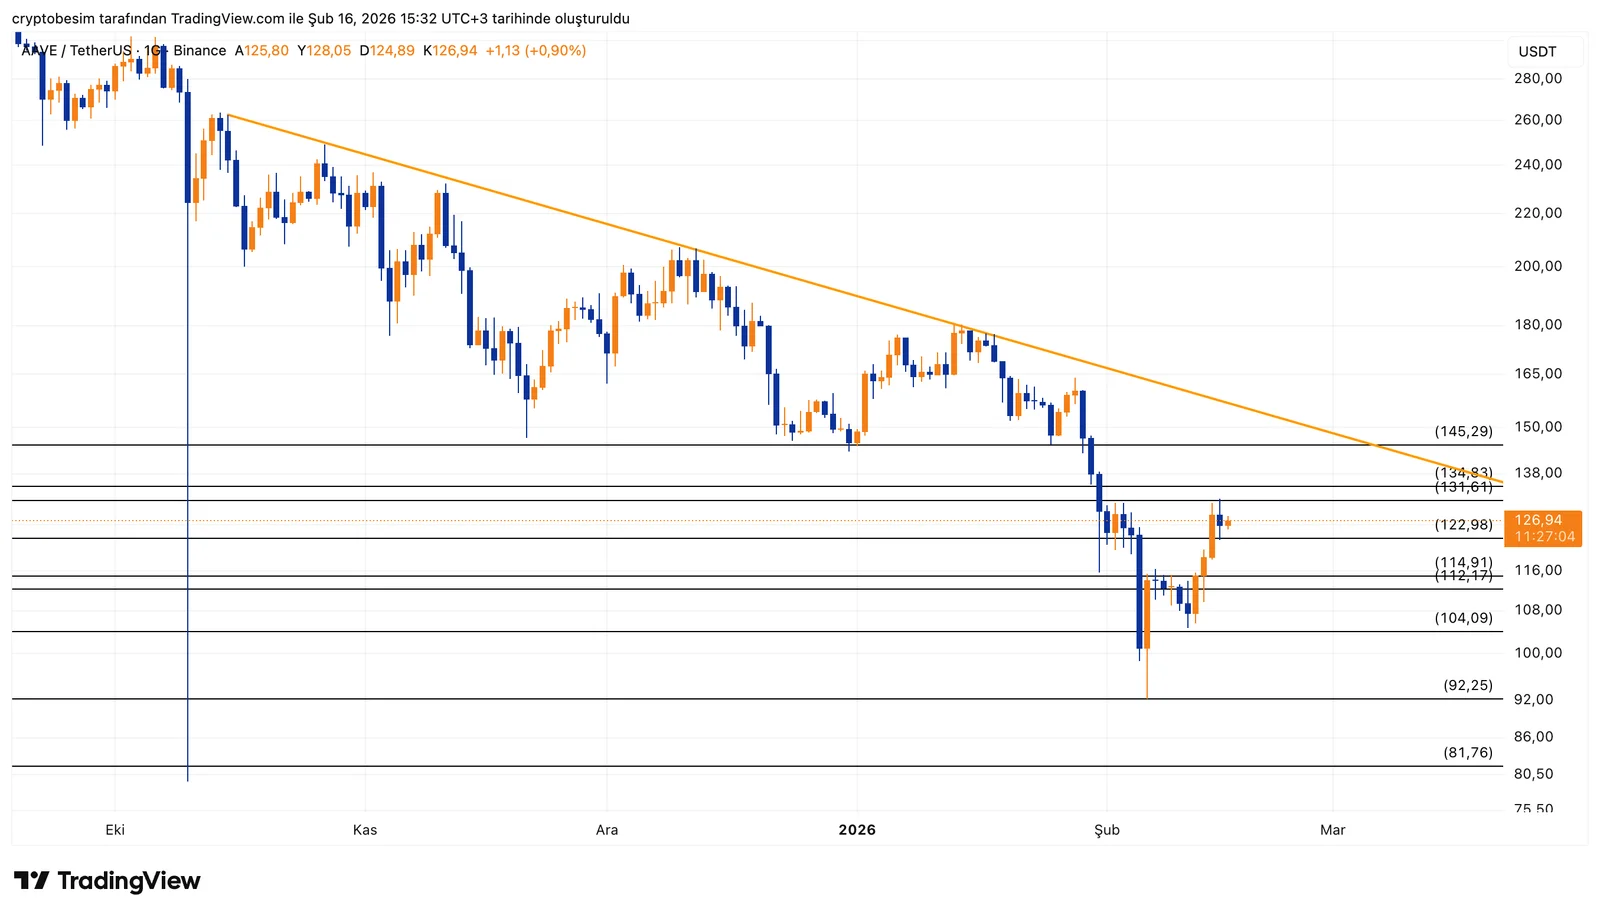
On the AAVE side, the main structure clearly remains in a downtrend. On the daily chart, every rebound has been met with selling at the upper main trendline. Price is currently trading again within an intermediate resistance zone.
The $131 level is the critical threshold.This area acts as both a horizontal resistance and sits close to the descending trendline. Unless $131 is broken, it is difficult to interpret upside movement as a trend reversal. Rebounds remain technical in nature.
Upside scenario;A daily close above $131 → the $138 – $145 range could be tested first.The real trend breakout would only become clear with sustained price action above $145.
Downside scenario;As long as price stays below $131, selling pressure may continue.First support: $122, followed by the $114 – $112 region.A move below $104 would signal renewed weakness.
In summary:As long as $131 is not broken, the primary downtrend remains intact.Without a breakout of this level, it is difficult to speak of a strong trend reversal.
These analyses do not provide investment advice and focus on support and resistance levels that are considered to offer short- and medium-term trading opportunities depending on market conditions. However, responsibility for execution and risk management lies entirely with the user. In addition, the use of stop loss is strongly recommended.


