
AAVE/USDT Technical Analysis
The GHO stablecoin project keeps expanding, and the Aave protocol is now launching on multiple blockchains, not just Ethereum. In addition, a large buyback program approved by the community has boosted confidence in the AAVE token. All these developments are starting to reflect on the price chart.
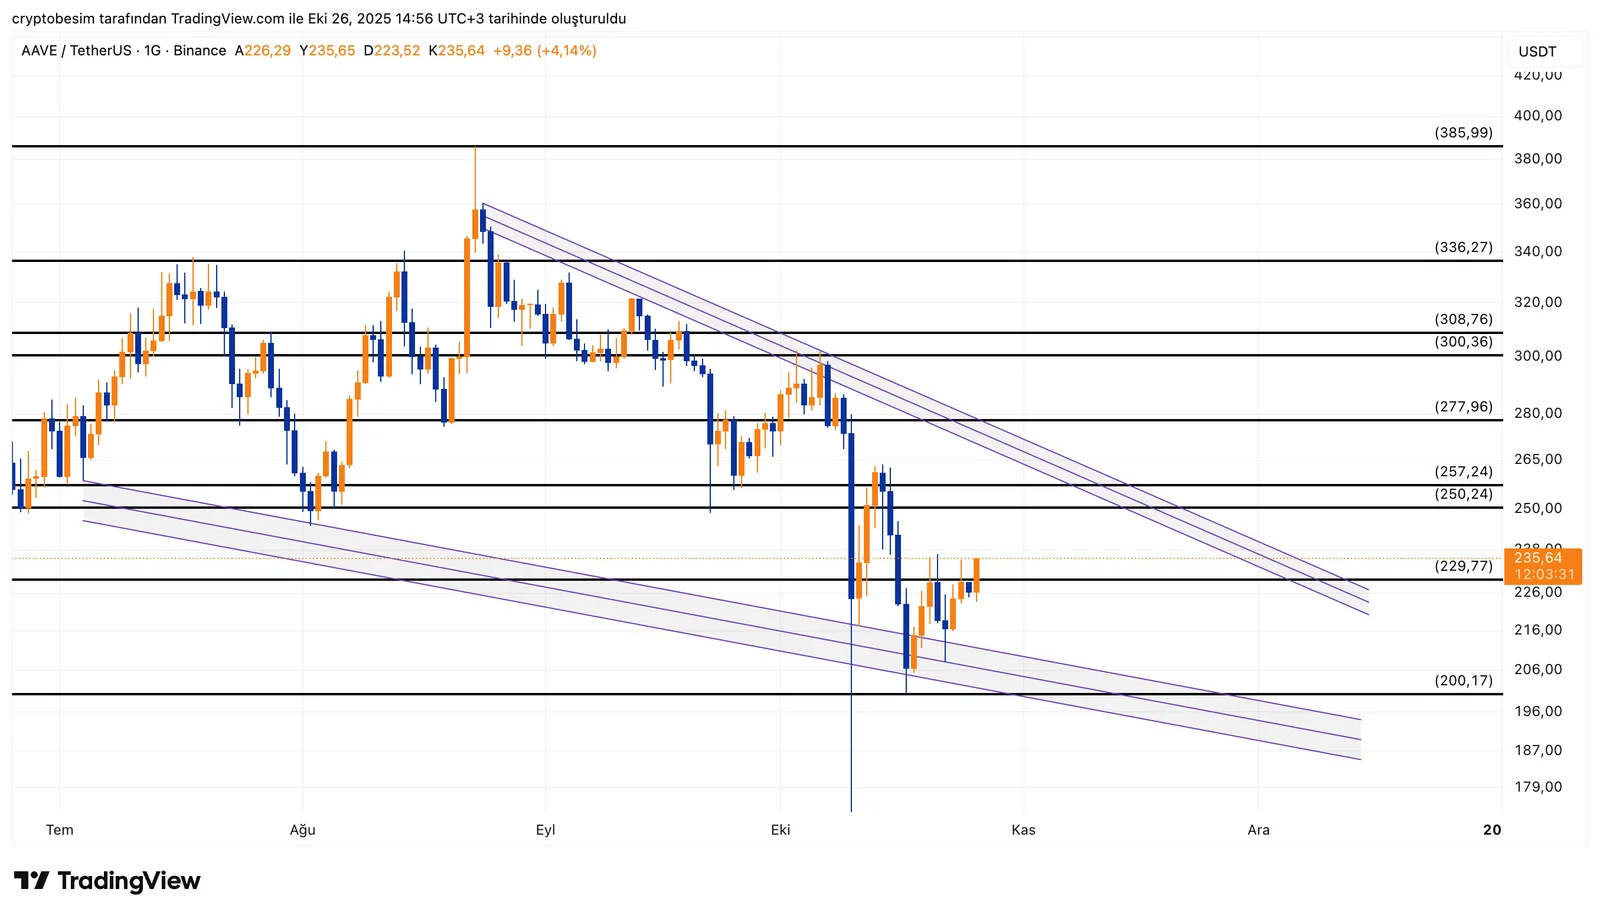
Analyzing the chart, we see that AAVE shows a falling wedge pattern, which is typically a bullish reversal formation. The price has started to recover from the lower part of the wedge and is now showing signs of upward momentum. AAVE is currently trading around $235. In the short term, the $250–$257 area stands out as the first key resistance zone. A strong breakout above this range could push the price toward $300–$308. The $300–$308 region is especially important because it represents the main breakout level of the wedge. If the price breaks and holds above it, this would confirm a bullish trend reversal and could lead to higher targets in the medium term.
- Support Levels: $229 → $217 → $200
- Resistance Levels: $250–$257 → $277 → $300–$308 → $336 → $385
Summary:
- AAVE is trading inside a falling wedge, a bullish setup.
- A breakout above $257 could start a move toward $300+.
- The main breakout zone is at $300–$308.
- Holding above $229 keeps the bullish scenario intact.
- Below $217, short-term weakness may appear.
These analyses, not offering any kind of investment advice, focus on support and resistance levels considered to offer trading opportunities in the short and medium term according to the market conditions. However, traders are responsible for their own actions and risk management. Moreover, it is highly recommended to use stop loss (SL) during trades.