
VANA/USDT Technical Analysis
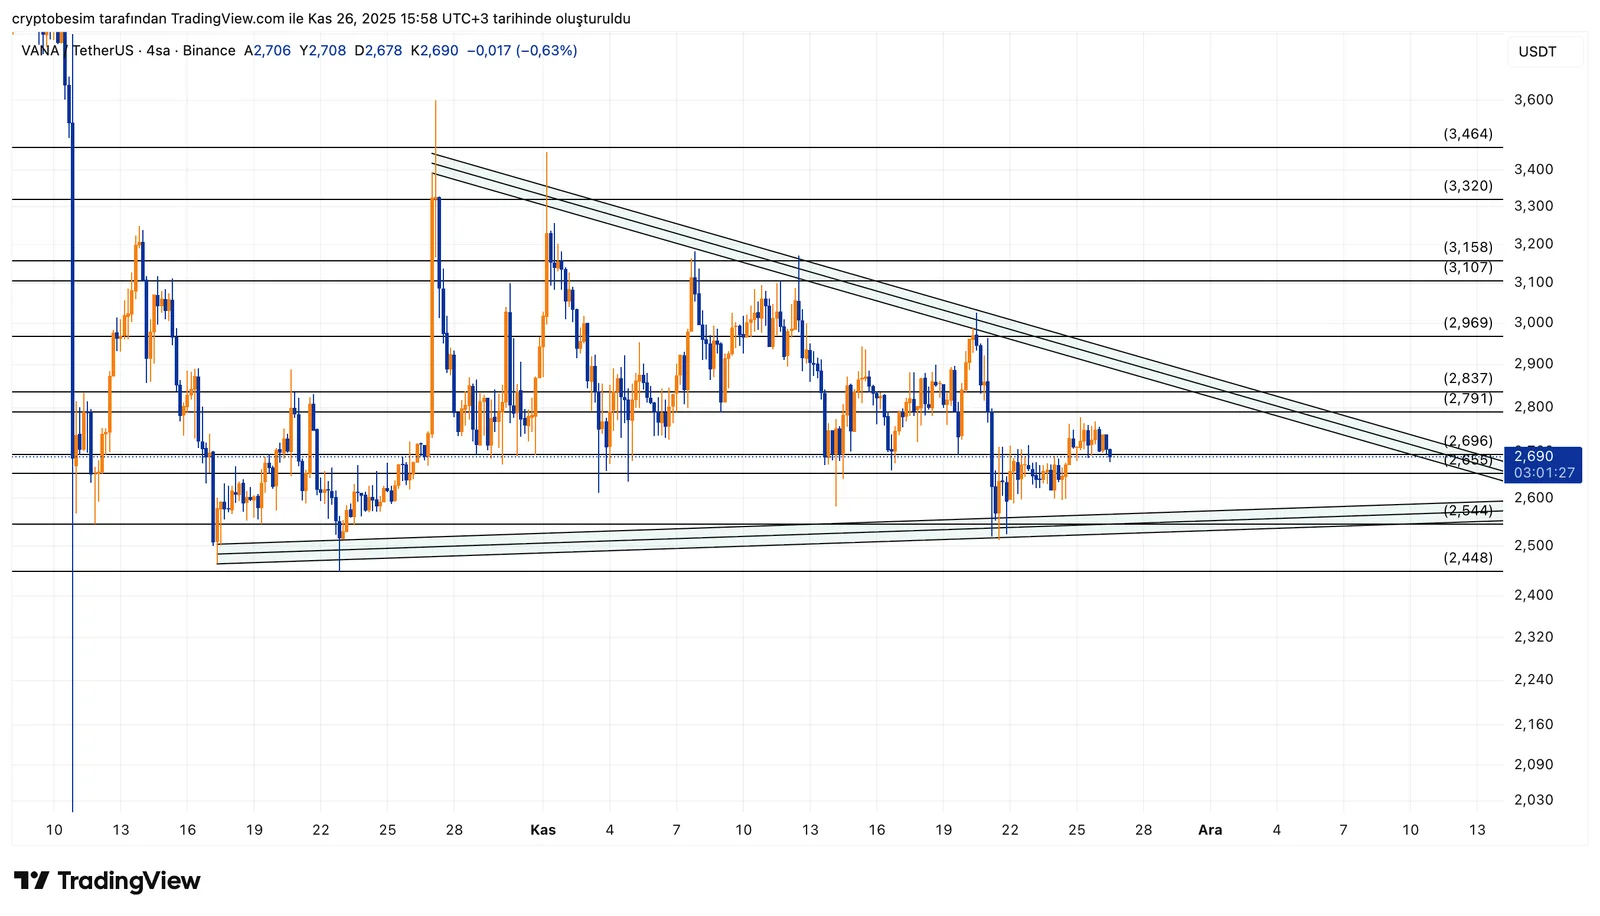
Analyzing the chart on the daily time frame, we see that the price of the coin VANA is getting squeezed between a descending trendline from above and a rising trendline from below. This creates a classic symmetrical triangle. As the price moves toward the end of the pattern, the decreasing volume also confirms this structure. The price is currently in the middle of the triangle and very close to defining a direction.
The first major resistance on the upper side is $2.79 – $2.83. If the price closes above this zone, the triangle breaks to the upside and a short-term move toward $2.96, followed by $3.10 – $3.15, can be triggered. However, the lower trendline of the triangle sits around $2.54 – $2.44. If this support fails, the triangle will be considered broken to the downside, and the correction may extend toward $2.30 – $2.20.VANA is in a tightening structure and entering its decision phase. A breakout above $2.83 is bullish, while a breakdown below $2.54 is bearish. Once either level is broken, the direction becomes clear.
These analyses, not offering any kind of investment advice, focus on support and resistance levels considered to offer trading opportunities in the short and medium term according to the market conditions. However, traders are responsible for their own actions and risk management. Morover, it is highly recommended to use stop loss (SL) during trades.


