
TRX/USDT Technical Analysis
The total value locked (TVL) in the TRON network has increased by 34% recently, surpassing the $6 billion mark. The rise in on-chain transaction volume, along with TRON's status as the leading blockchain for USDT transfers, has renewed both institutional and retail interest in TRX.
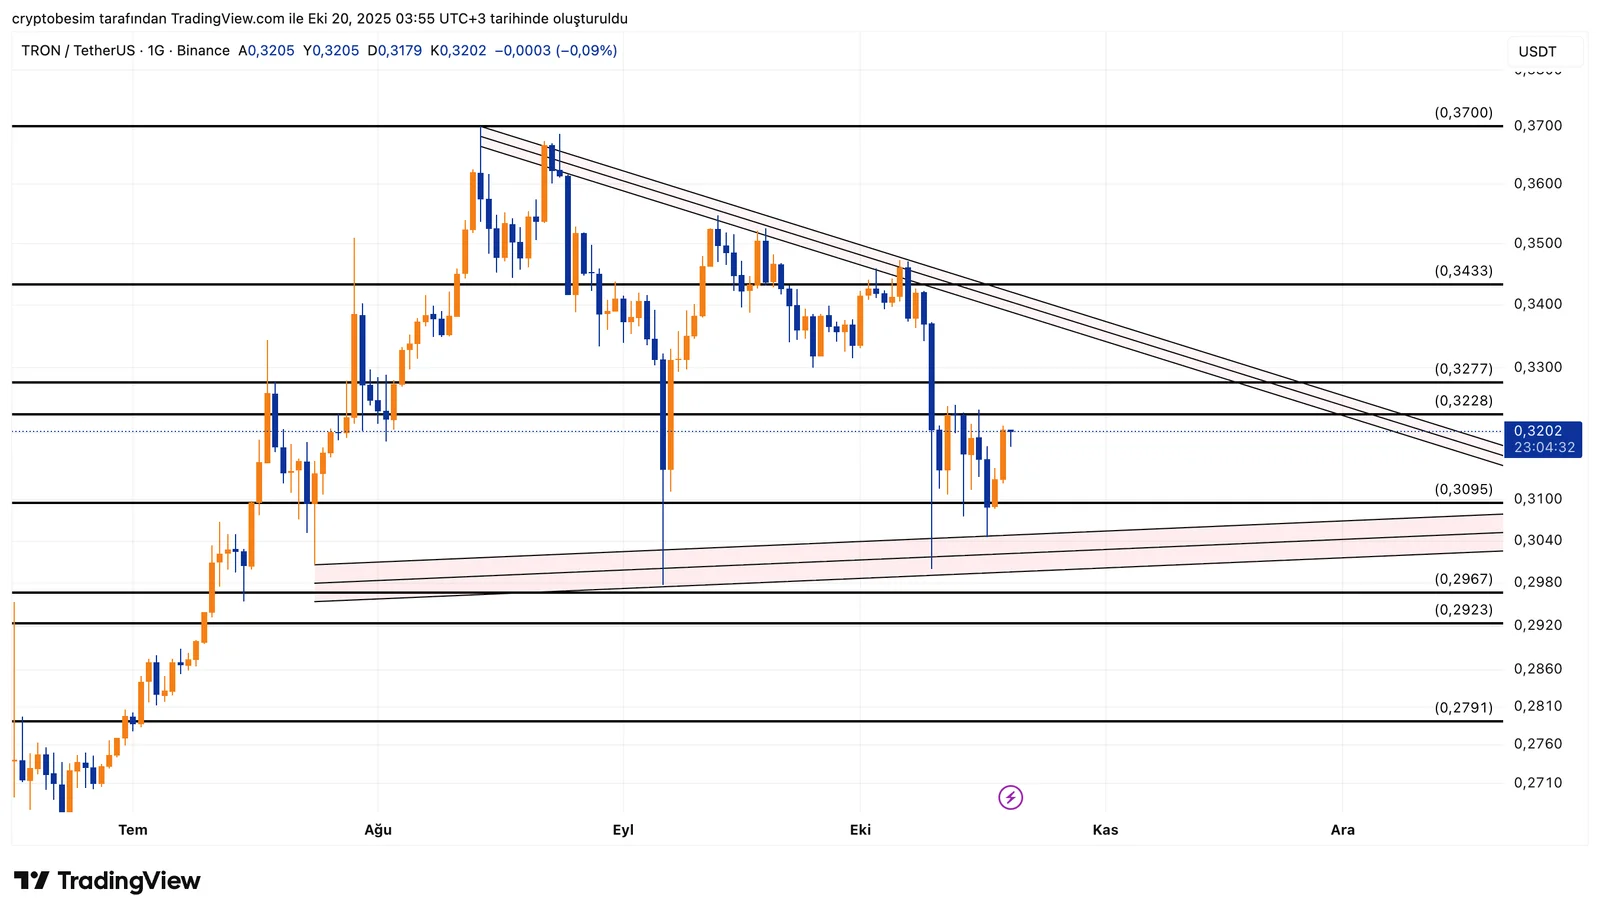
Analyzing the chart, we see that TRX continues to trade within a symmetrical triangle pattern, indicating ongoing price compression in the medium term. After the recent sharp drop, the price bounced off the lower boundary of the triangle and recovered to around $0.32 — a sign that buyers remain active at support.
In the short term, the $0.3228–$0.3277 zone stands as a key resistance area. Unless TRX breaks clearly above this zone, price action may remain within the triangle. However, the chart structure still favors a potential upside breakout, particularly if supported by strong volume.
On the downside, the $0.3095–$0.3040 area acts as short-term support, while the $0.2967–$0.2923 zone serves as a major support level. This zone aligns with the triangle’s lower trendline, where buyers could be expected to step in again if tested.
Summary:
- TRX remains inside a tightening symmetrical triangle pattern.
- A breakout above $0.3228–$0.3277 could lead to targets at $0.3433 and $0.3700.
- As long as the $0.3040–$0.2967 support zone holds, the outlook remains positive.
- A daily close below $0.2923 would invalidate the pattern and likely trigger stronger selling pressure.
- With the triangle nearing its apex, a strong directional breakout is likely soon — a daily close above $0.3277 would confirm a bullish move.
These analyses, not offering any kind of investment advice, focus on support and resistance levels considered to offer trading opportunities in the short and medium term according to the market conditions. However, traders are responsible for their own actions and risk management. Moreover, it is highly recommended to use stop loss (SL) during trades.


