
Historic Breakout in the Crypto Market: Is the TOTAL Chart Signaling a New Super Bull Wave?
- Major Structure: Combination of “Falling Wedge + Cup & Handle + S/R Flip”
The total market capitalization (TOTAL) chart in the cryptocurrency market may be indicating that we are on the verge of a new super bull season, having broken a historically significant structure from a technical analysis perspective. The weekly chart below illustrates this long-term technical formation in detail. Let’s examine the formations, breakouts, and trend structures on the chart to understand why the market is experiencing a major breakout and where it could go next.
Three major structures stand out on the chart:
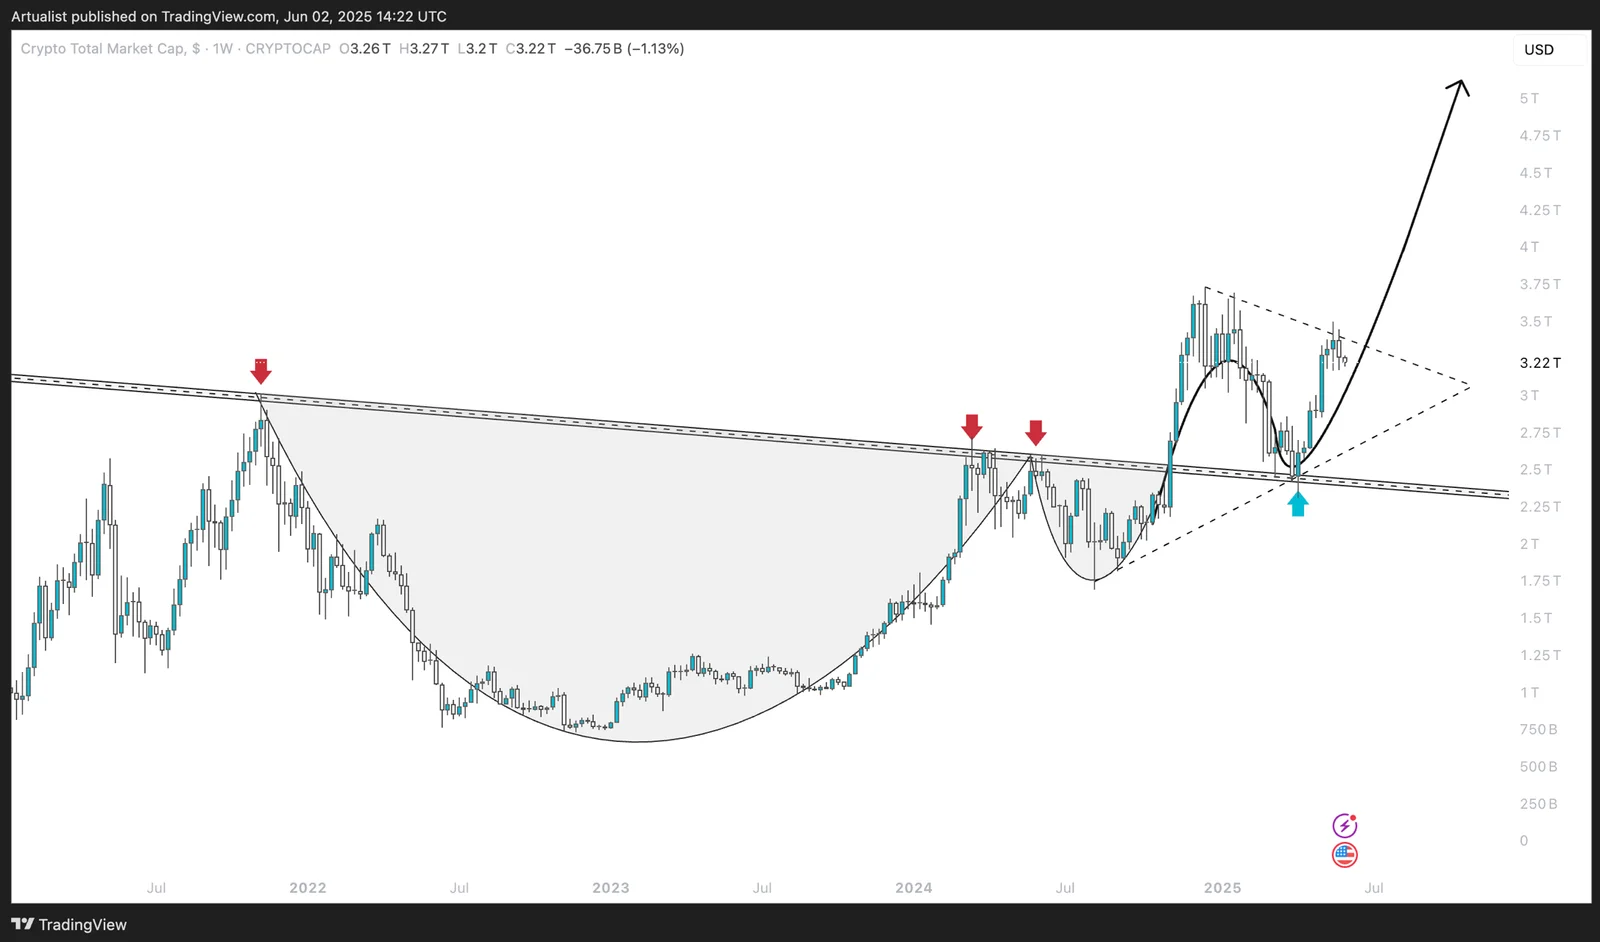
a) 2021 ATH (All-Time High) Trend Resistance: This resistance line, indicated with red arrows, has been tested and rejected multiple times since 2021. It formed a strong macro resistance zone in the ~$2.85T – $2.95T USD range.
b) Falling Wedge Structure: The price compression between 2022 and 2025 resembles a classic falling wedge formation. These types of structures generally break to the upside.
c) Cup & Handle Formation: The large “cup” formation that began at the 2021 peak and continued through 2024 formed a “handle” with a short correction at the beginning of 2025. This type of formation is known in technical analysis as a bullish continuation pattern.
Successful Retest: Resistance Becomes Support
The retest shown with the blue arrow on the chart is extremely critical. The macro trend line from 2021 was broken to the upside in 2025 and then successfully retested, acting as support. This is a classic example of a Support/Resistance Flip (S/R Flip). It confirms that the breakout is valid and sustainable.
Technically:a) Weekly closes are now occurring above this line.b) Liquidity was taken during the retest, followed by a strong recovery.
This structure confirms that the market is preparing for its next major leg up.
Ascending Triangle + Parabolic Curve: Breakout Pattern After Compression
The symmetrical triangle on the right side of the chart is a classic compression model. Especially when such compression breaks upward with volume, parabolic movements often follow.
- The lower band of the triangle aligns with both the ascending trend support and the handle portion of the large formation.
- Movement toward the upper band generally signals the potential for major breakouts.
If the breakout from this structure occurs to the upside, the targets, based on Fibonacci and formation measurements, could be:
- $3.85T USD (initial target),
- Between $4.65T and $5.00T USD.
What Does the Macro Trend Say?
This breakout is not just a technical formation but also a major confirmation that the bull cycle is continuing. Key supports include:
- The 5-year uptrend: still intact.
- Macro retest successfully completed.
- Formations (cup-handle, wedge, triangle) are all bullish.
All these technical indicators suggest that the market is structurally preparing for an upward explosion and that this move could launch not just a short-term rally but a medium-to-long-term super trend.
Conclusion: Has the Super Bull Begun?
The chart delivers several clear messages:
- The trend that couldn’t be broken since 2021 has now been surpassed.
- Resistance has turned into support (S/R Flip).
- The cup & handle formation is complete.
- A breakout structure has formed following compression.


