
TAO Technical Analysis
Combining AI and blockchain, TAO has recently gained strong attention. Trading volume has tripled, and institutional buyers are showing interest. The upcoming “halving” event in December will reduce supply, raising expectations for the future. Let’s see how this reflects on the price chart.
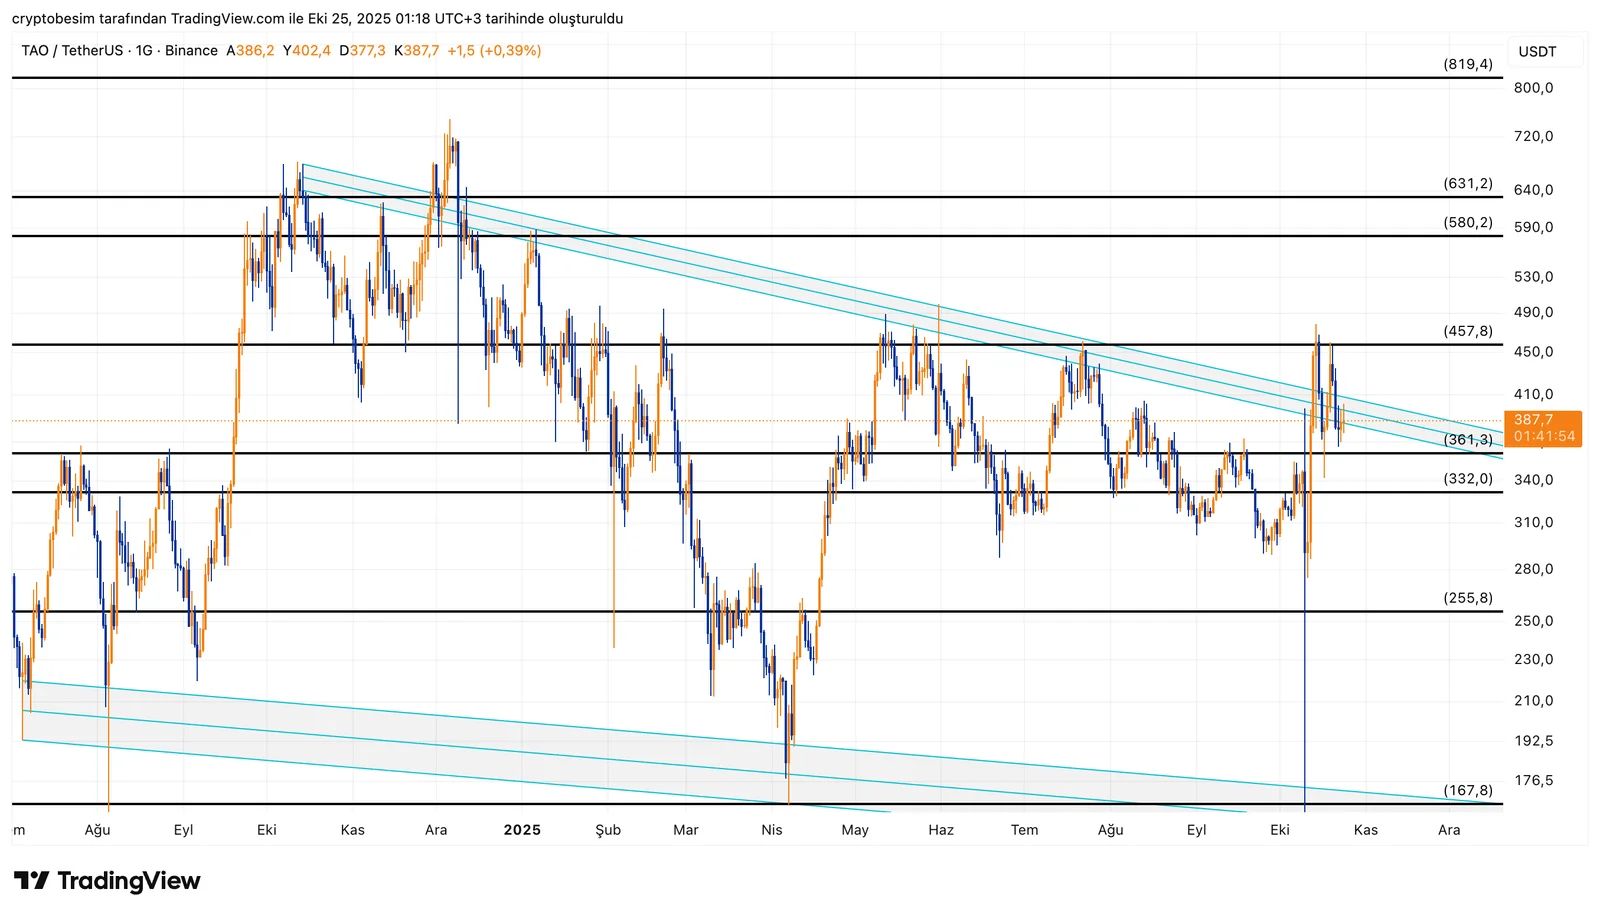
Analyzing the daily chart, we see that TAO is still trading inside a large falling channel (or wedge). After being rejected around $457, the price found support above $361 and is now trading near $387. This area is important, as it shows that TAO is close to a possible breakout zone. The $361 level is now a strong support area. If the price closes below $332, it could pull back toward $255, and in a deeper correction, even $167.
If the price continues upward, the first resistance is $420, followed by the key zone between $457–$460. A clear breakout above $457 would confirm the end of the downtrend and could start a new bullish wave.
- Targets after breakout:
- $420
- $457
- $500
- $580
- $631
- $819
In short:As long as TAO stays above $361, the outlook remains positive. A daily close above $457 would confirm the breakout and could open the way to $580–$819 levels in the mid to long term.
These analyses, not offering any kind of investment advice, focus on support and resistance levels considered to offer trading opportunities in the short and medium term according to the market conditions. However, traders are responsible for their own actions and risk management. Moreover, it is highly recommended to use stop loss (SL) during trades.


