
SOL Technical Analysis
Solana is increasing its speed and reliability with new upgrades. Features like “Firedancer” and “Alpenglow” are improving the validator system. At the same time, institutional investors are showing more interest, and there have been strong inflows into SOL recently. This positions Solana not just as an altcoin, but as a long-term blockchain project with real potential.
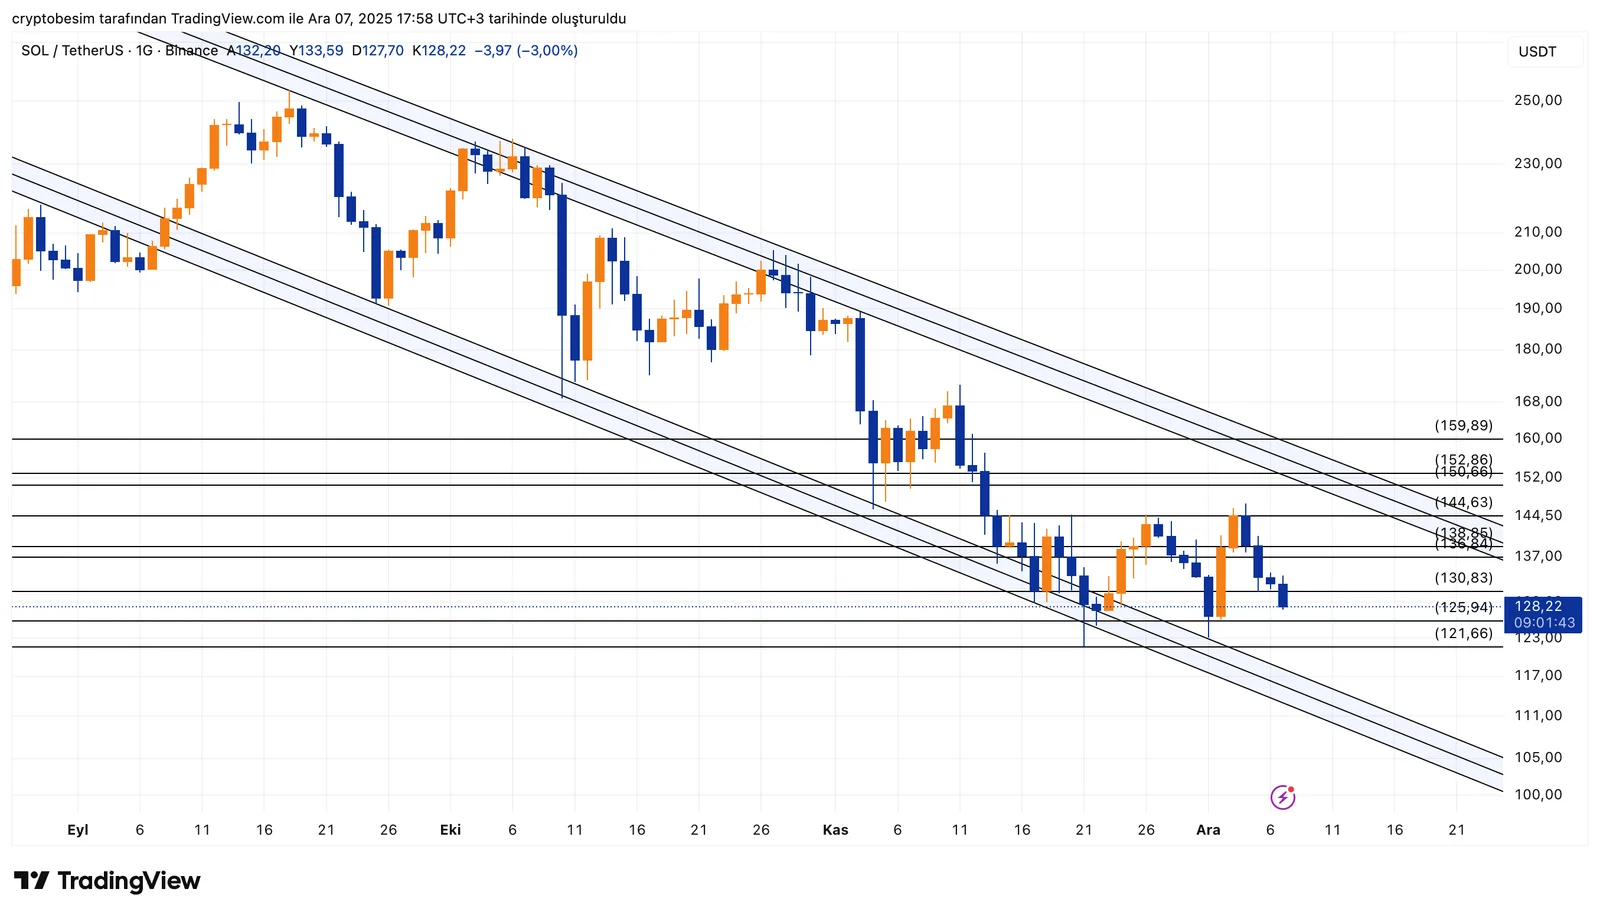
Analyzing the chart on the daily time frame, we see that the coin is still trading inside a large descending channel, so the main trend is still down. But the recent bounce from the lower channel shows that buyers are trying to push the price up again. As long as the price holds above $125, the short-term outlook looks positive.
The $125 level is important because it’s both a horizontal support and the bottom of the recent bounce. If SOL holds above this area, the first target is the mid-channel zone at $138–$144. This area has caused many pullbacks before, so it’s the first strong resistance.
If the price breaks above $144, then a move toward the upper channel around $150–$152 becomes possible. This level is a major trend resistance. A rejection here would be normal, but if SOL breaks above it, the downtrend could finally end and a new trend may start.
On the downside, the $121–$122 area is key support. If this zone is lost, the price could drop deeper toward $110–$105 and the recovery scenario would weaken.
These analyses, not offering any kind of investment advice, focus on support and resistance levels considered to offer trading opportunities in the short and medium term according to the market conditions. However, the user is responsible for their own actions and risk management. Morover, it is highly recommended to use stop loss (SL) during the transactions.


