
MON/USDT Technical Analysis
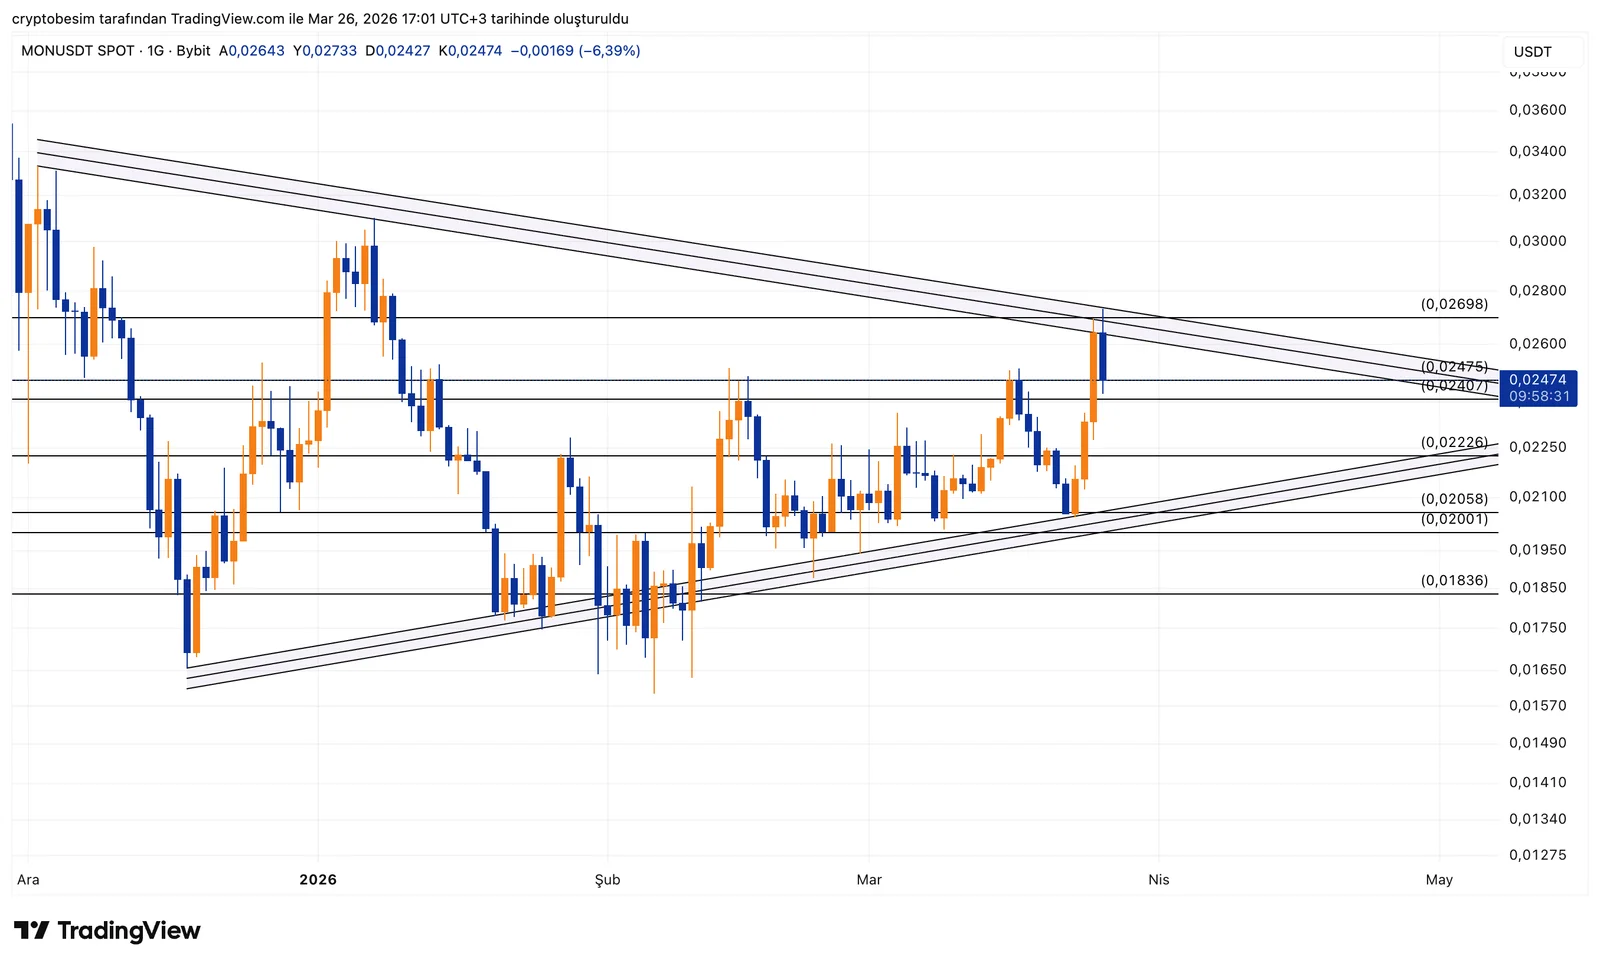
On the MONAD side, the chart has been forming a consistent contraction from the very beginning. Highs are coming down, while lows are moving upward. Price has gradually tightened and is now approaching the end of the triangle.
Currently, price is in the 0.024–0.025 range, moving close to the upper trendline. This indicates an upward attempt. It previously faced selling pressure in this area, so seeing a similar reaction again would be normal.
On the downside, the 0.020–0.021 range is working well. Price has recovered from this area each time it pulled back. Therefore, in possible retracements, this will be the first level to watch.
On the upside, the 0.026–0.027 zone is critical. It coincides with the upper boundary of the triangle. If price manages to break above this area and hold, the long-standing consolidation may resolve to the upside and momentum can increase.
Overall, the range has narrowed and the structure is now in its final phase. In formations like this, breakouts usually do not take long, and whichever side breaks, the move tends to accelerate in that direction.
These analyses do not provide investment advice and focus on support and resistance levels that are considered to offer short- and medium-term trading opportunities depending on market conditions. However, responsibility for execution and risk management lies entirely with the user. In addition, the use of stop loss is strongly recommended.


