
LINK/USDT Technical Analysis
Chainlink has taken another major step toward bringing real-world data on-chain for institutional use. In recent days, ETF-related progress, renewed whale accumulation, and growing attention around the project have strengthened the case for LINK evolving beyond a simple crypto infrastructure token, potentially becoming a bridge between blockchain and traditional finance.
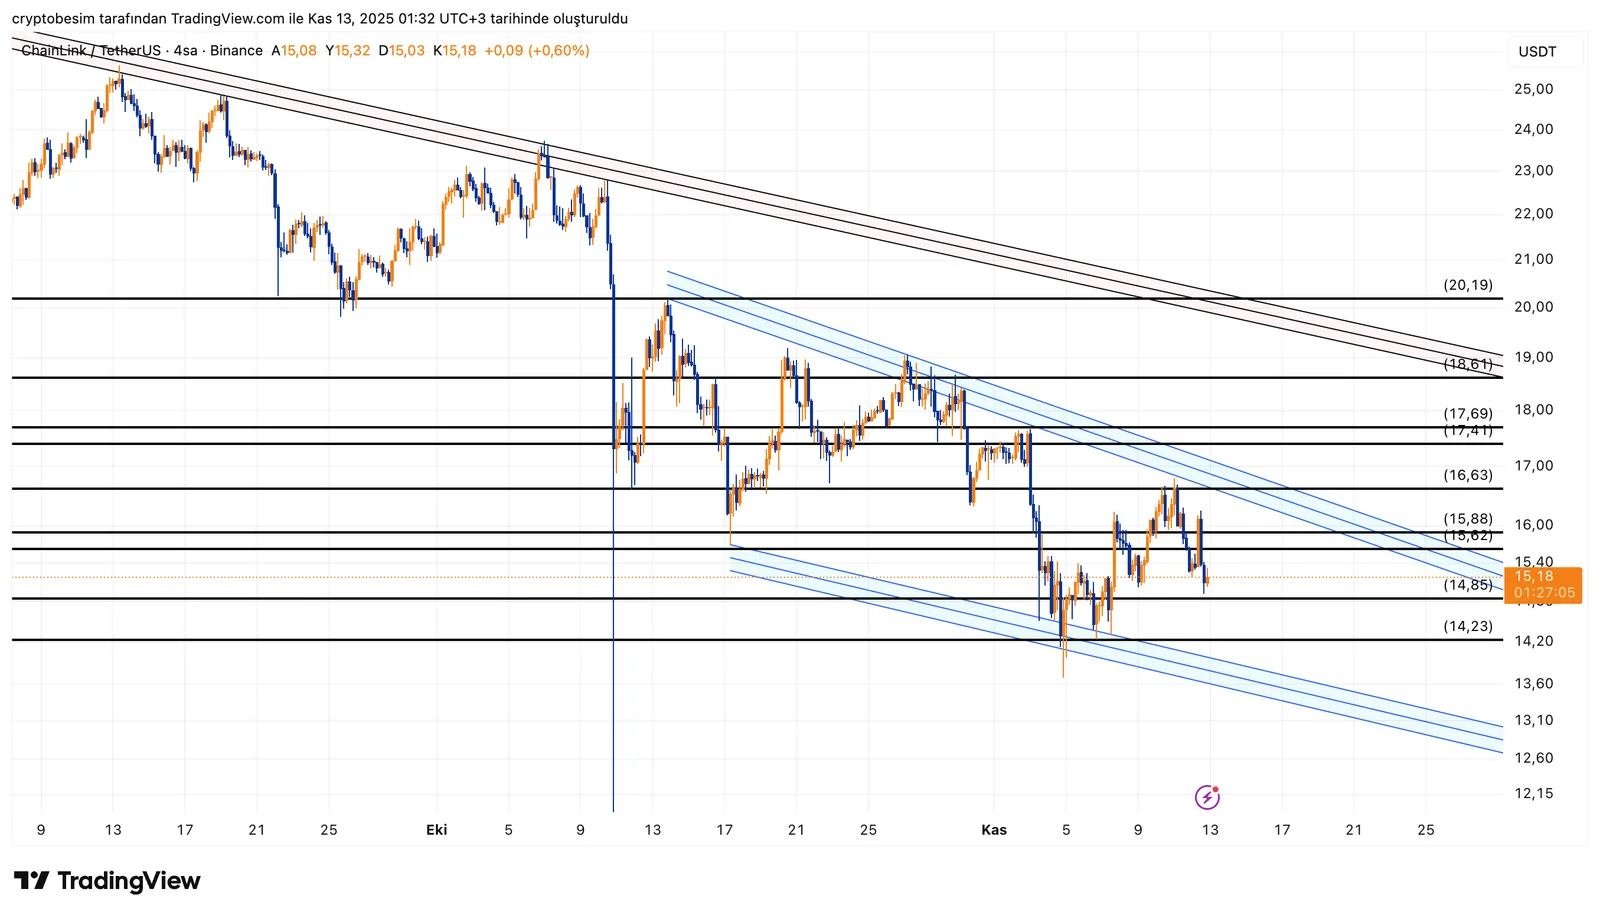
Analyzing the chart on the 4-hour time frame we see that the coin is currently trading within a falling wedge formation, a pattern that often appears near the end of downtrends and suggests the potential for a bullish reversal. The price is currently trading around $15.18, hovering near the midline of the short-term channel. While a minor bounce has occurred from the lower boundary, the overall structure remains compressed within the wedge.
If a breakout occurs, the first target lies in the $17.40 – $17.70 range. This is a zone notable for its prior trend test and high trading volume. If the momentum continues in line with the wedge’s height, a further move toward the $18.60 – $20.00 resistance band becomes possible.
On the other hand, losing the $14.85 support would expose the price to a potential pullback toward $14.20, the wedge’s lower boundary. This area represents the final defense for maintaining the current structure and could serve as a potential rebound zone.
Support and Resistance Levels
- Support levels: $14.85 –$14.20 – $13.10
- Resistance levels : $15.88 – $17.40 – $18.60 – $20.00
These analyses, not offering any kind of investment advice, focus on support and resistance levels considered to offer trading opportunities in the short and medium term according to the market conditions. However, the user is responsible for their own actions and risk management. Morover, it is highly recommended to use stop loss (SL) during the transactions.


