
ETH Technical Analysis
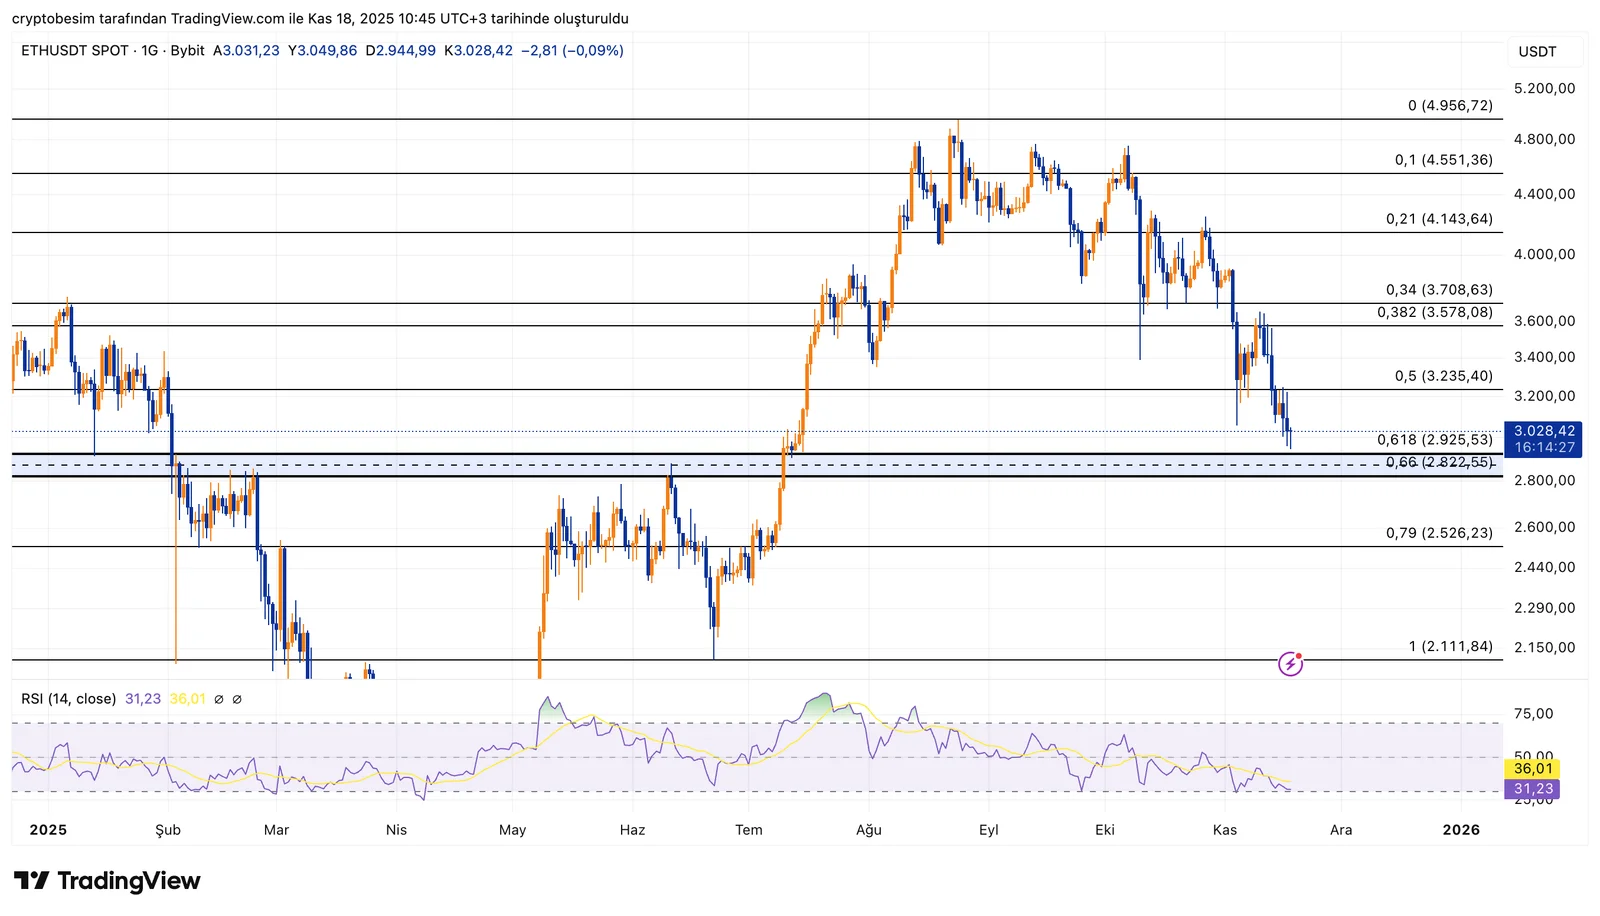
Analyzing the chart on the daily time frame, we see that ETH has pulled back exactly into the expected zone on the daily chart. This zome refers to the 0.618–0.66 Fibonacci band. This area has acted as a strong demand zone in past moves and has often been the starting point of major reversals. The price is currently sitting right on this band, and we can see an effort to hold this level.
The RSI is also approaching oversold territory, showing that selling pressure is weakening and downward momentum is losing strength. When we combine these signals, it’s clear that ETH is at a level that is very suitable for a potential bounce.
Short-term outlook is straightforward:
- As long as ETH stays above $2,925 (the 0.618 level), the chance of a recovery remains strong.
- If an upward reaction comes, the first target is $3,235.
- After that, the $3,578 – $3,708 zone stands out as the main resistance area. A breakout above this range could trigger a renewed bullish momentum.
In the downward scenario:
- The $2,822 – $2,526 range (0.66–0.79 Fibonacci band) is the final retracement zone.
- Even if ETH drops into this area, the larger trend structure would still remain intact.
ETH has reached the most critical zone of its Fibonacci correction. A strong green candle from this region could clearly signal the start of a short-term recovery.
These analyses, not offering any kind of investment advice, focus on support and resistance levels considered to offer trading opportunities in the short and medium term according to the market conditions. However,t raders are responsible for their own actions and risk management. Morover, it is highly recommended to use stop loss (SL) during trades.


