
EDU Technical Analysis – 4-Hour Chart
EDU, after breaking down the rising channel structure, went in search of direction in the short term. The price is currently trading at the levels of $0.1471 and quite close to the resistance of $0.1482. This was a region that used to work as both support and resistance. Therefore, the price movement that will take place here will determine the short-term direction.
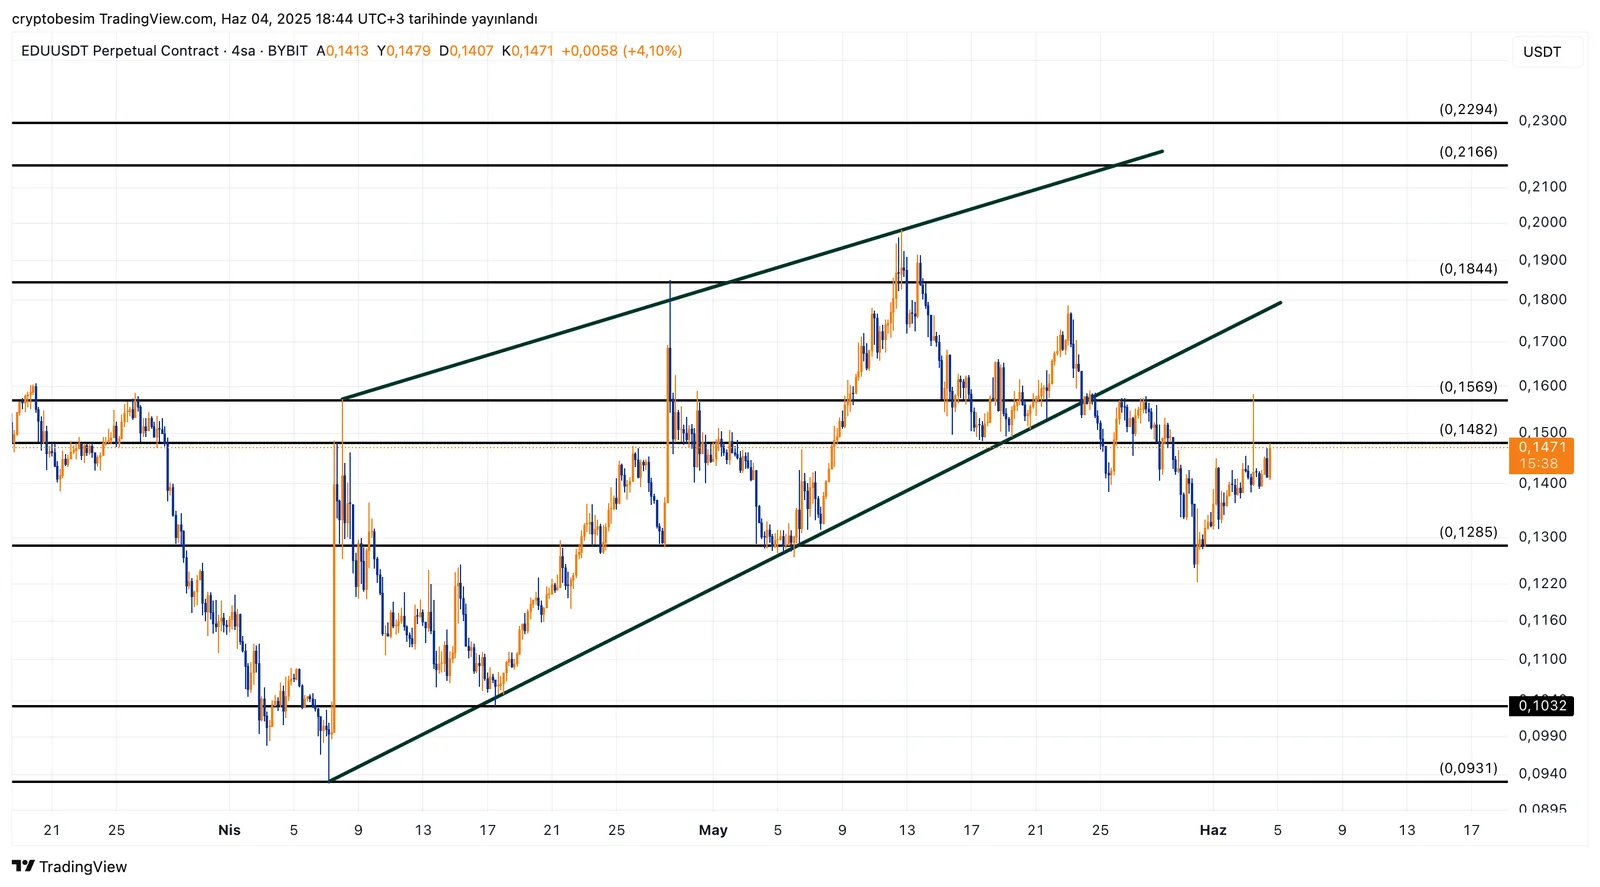
In the upward scenario, closures above $0.1482 should be followed. If this level is exceeded, the first resistance will be at $0.1569, followed by the $0.1844 levels. However, as long as it remains below $0.1482, upward attempts may encounter selling pressure. Especially if $0.1569 is not passed, the rises may remain weak.
Below, the $0.1400 and $0.1285 levels should be followed as support. If these regions are broken, the level of $ 0.1032, which was previously a strong buying zone, will be raised again. Under this zone, an area opens up to the $0.0931 dip level.
As for the overall structure, EDU is currently trying to get out of technical printing. However, a clear fracture has not yet arrived. Although there is a desire to recover after the channel break, the resistance zones are quite strong. The levels of $ 0.1482 and $0.1569 will be decisive for the clear direction.


