
Bitcoin at New Thresholds — Markets Enter a Critical Fed Week
Bitcoin has completed the first quarter of 2025 with significant volatility. The rally that began from the $73,000–$74,000 range extended up to the $96,000 level and still largely maintains its upward structure. However, at this point, the chart structure is starting to show signs of saturation. Selling pressure from the upper band of the ascending parallel channel has created a short-term resistance zone.
Ahead of the May 7 FOMC meeting (Fed Interest Rate Decision), a cautious wait-and-see mood dominates global markets. In this context, it is crucial to evaluate both macroeconomic developments and Bitcoin’s technical structure together. Let’s begin.
1. Critical POI Levels and S/R Flip Zones
The first notable feature on the chart is the clear marking of two key POI (Point of Interest) levels:
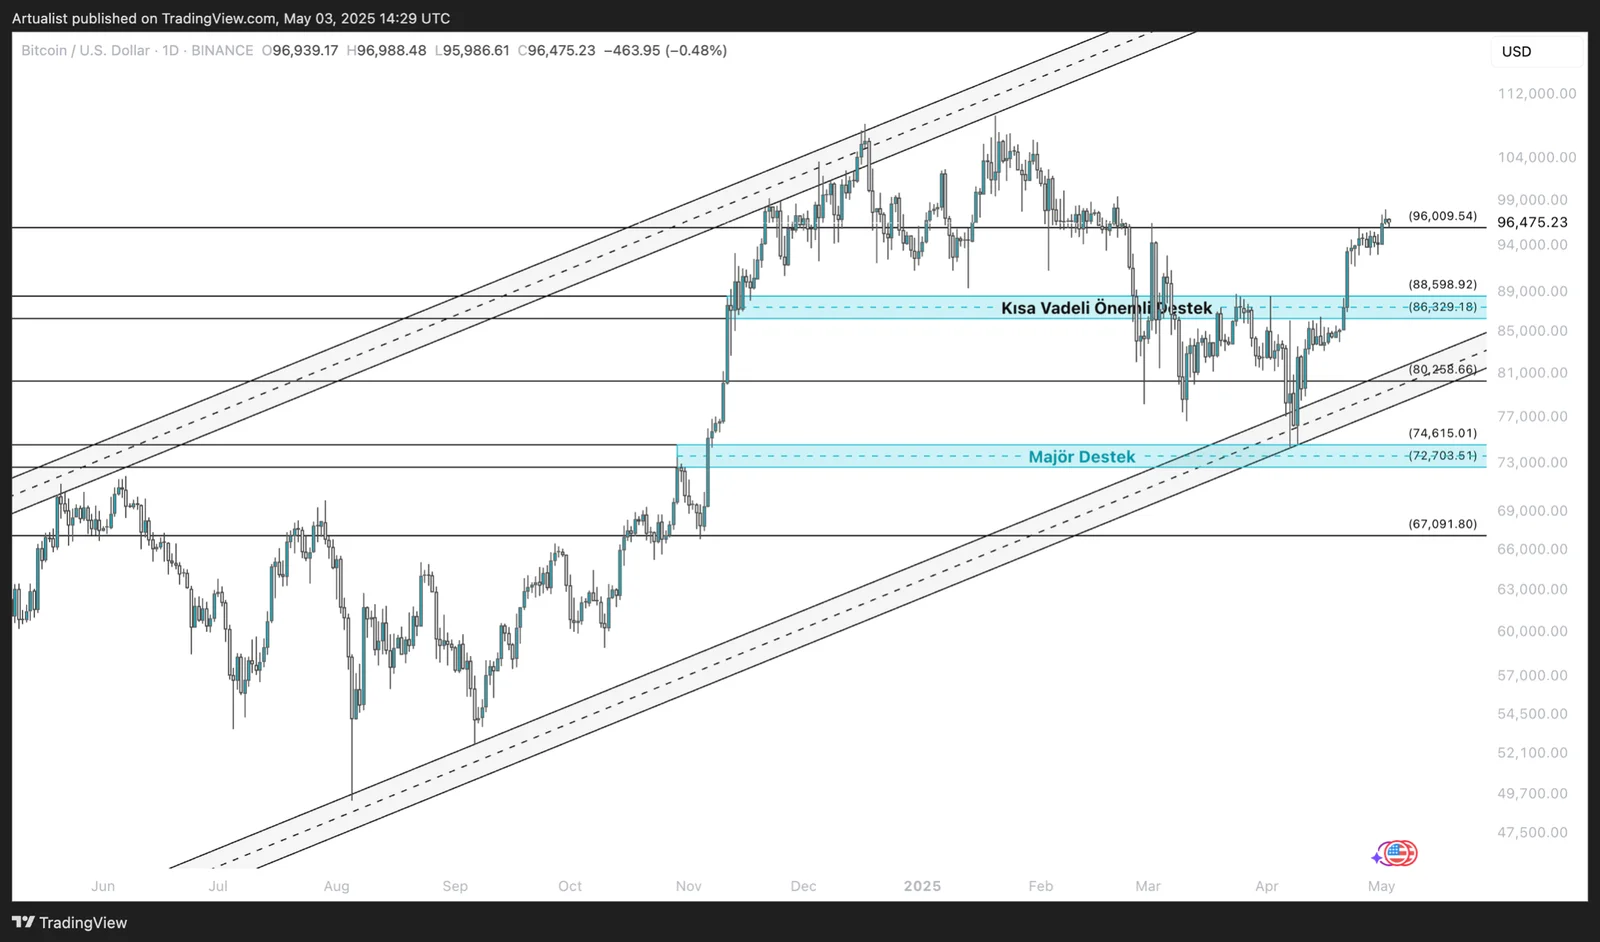
$96,000 Level (Resistance POI): This level coincides with the previous local top and represents a resistance zone that the current price is testing but struggling to break. This area is also important in terms of “liquidity sweep,” as many short positions are stopped out here, which increases the potential for a short-term fake breakout. A sustained breakout of this level could trigger the liquidity between the $99,000–$104,000 range.
$88,600–$86,200 S/R Flip Support Block: This zone was confirmed after a strong retest following a previous breakout. The support area has held well and triggered an aggressive response due to a “short trap” effect. As long as there are no 4H or daily candle closes below this zone, the bullish structure can be considered active.
These two regions are highly significant in terms of both volume and structural transformation. Traders should closely monitor these areas as POIs and structure their trading plans with appropriate risk management.
2. Trend Structure, Channel Support, and Rising Low Formation
The chart shows that the price is moving within a long-term ascending trend channel. The lower band of the channel has been tested multiple times and received strong reactions, while upward breakouts have faced profit-taking at the upper boundaries.
- a) Trend Continuity: The clearly visible higher high and higher low pattern on the chart confirms the continuation of the bull trend. Especially the major low in March (around $73,000) and the higher low in April suggest a healthy price structure.
- b) Mid-Channel Line Acting as Support: After the price bounced from the $80,200 level, the middle line of the channel has acted as a support. These inner lines often serve as pivot points in intra-channel micro-wave movements. Holding above this area has allowed the price to climb back up to the $96,000 resistance.
- c) Breakdown Risk: However, if the lower band of the channel is tested again, it could lead to a structural breakdown. The $74,600 and $72,700 levels are critical supports in this context. A break below these levels might bring a bearish trend scenario into play.
3. Liquidity Zones and Manipulation Risks
One important observation on the chart is the clear pricing around liquidity clusters. In particular:
- a) Liquidity Sweep Around $96,000: There’s a build-up of buy-side liquidity in this zone. Wick formations and low-volume price spikes suggest that large players are pushing price up to liquidate shorts and then driving it back down.
- b) Dips Below $88,600 Showing “Fakeout” Behavior: This region likely acts as a POI where algorithmic buy orders are triggered. Volume indicators show increased buying pressure around this level.
- c) The Way Liquidity Zones Function Offers This Insight: Key support/resistance zones should not only be evaluated technically but also from a liquidity-hunting perspective.
4. May 7 Fed Decision and Potential Scenarios
The FOMC decision on May 7, 2025, stands out as the most significant macro factor that will determine the direction of this technical structure. Potential scenarios include:
- a) Rate Cut (0.25% or More): In this case, a sharp upward move can be expected in all risk assets, especially Bitcoin. A strong breakout of the $96,000 level could target the $99,000–$104,000 range. Traders should watch for the sustainability of momentum, keeping an eye on indicators like RSI and MACD.
- b) Rate Hold (4.50%): In this scenario, the market may initially react neutrally, but Powell’s tone during the press conference will be decisive. A hawkish stance could pull the price back to the $88,600 support, while a dovish tone may strengthen upward momentum.
5. Summary and Strategic Takeaways
The POI levels ($96,000 and $88,600) are the main areas to watch for trading decisions. The trend structure is upward, but being near the upper boundary of the channel may trigger profit-taking. Liquidity zones conceal the true intentions of market participants. Therefore, avoiding the “panic on dips” and “euphoria on pumps” trap is essential. The May 7 Fed decision will test not only Bitcoin’s technical but also its psychological levels. For long-term investors, the $72,700–$74,600 range may offer accumulation opportunities, while short-term traders should consider POI breakouts for trades with well-defined stop-loss levels.
This analysis does not constitute investment advice. It focuses on support and resistance levels that may present potential short- to mid-term trading opportunities depending on market conditions. However, all responsibility for trading decisions and risk management lies entirely with the user. The use of stop-loss orders is strongly recommended for any trade setup shared.


