
BNB Technical Analysis
As part of its partnership with Kyrgyzstan, Binance has issued a state-backed stablecoin on its own blockchain, and BNB tokens were used as part of the treasury reserve during this process. This move highlights BNB’s potential not only as an exchange token but also as a “nation-level digital asset reserve.” Moreover, global market uncertainty and ongoing regulatory shifts have brought BNB’s role as a “value preservation asset” back into focus.
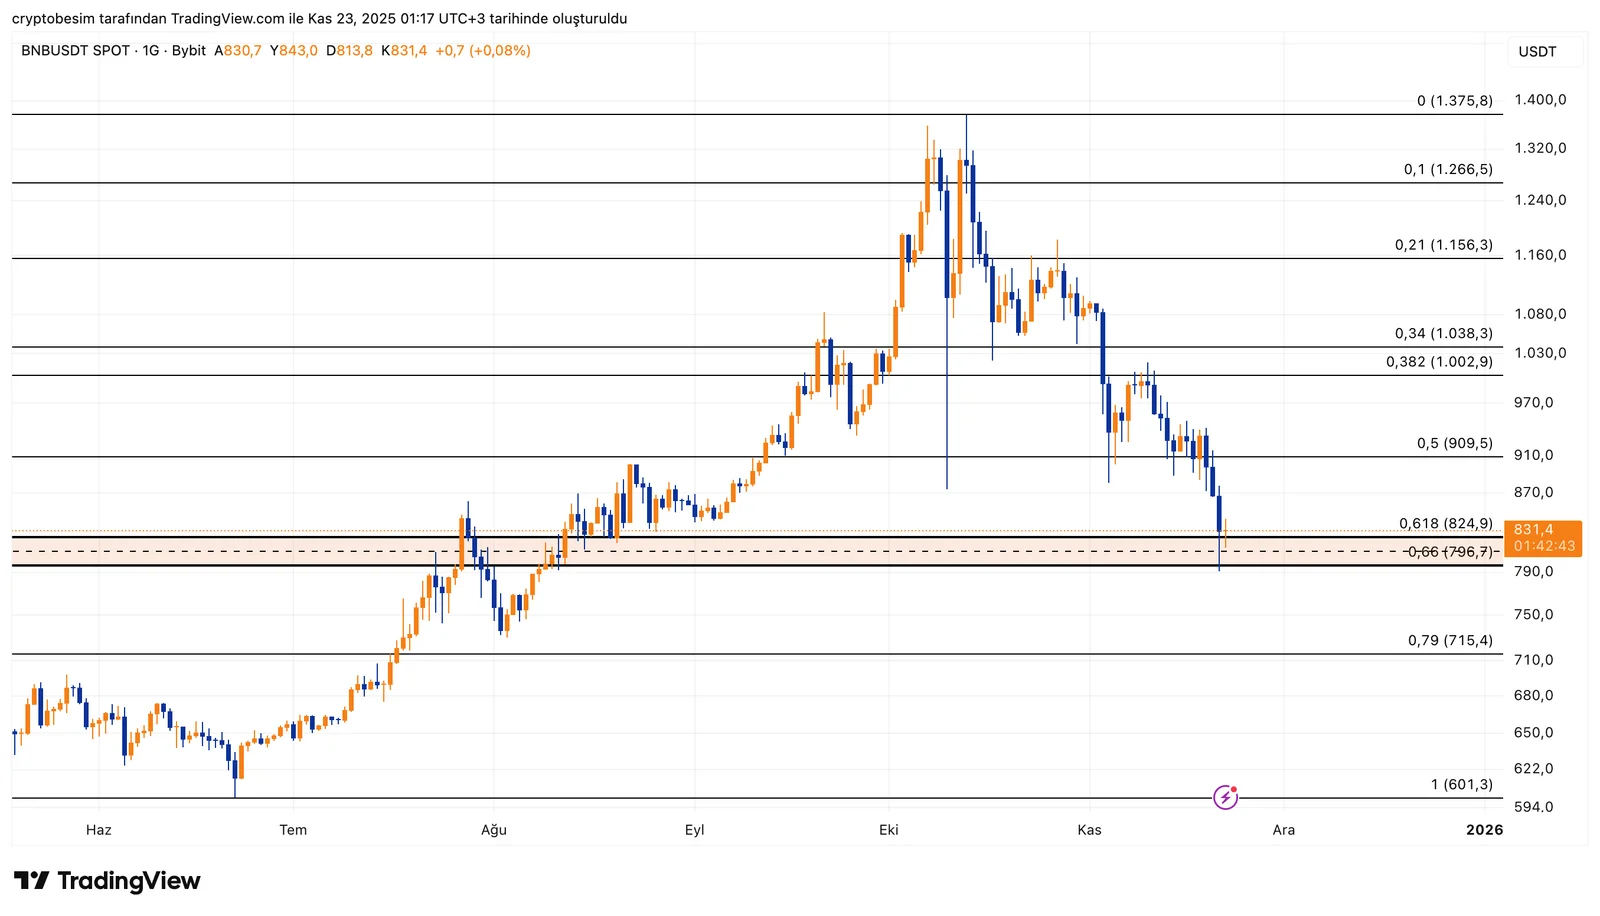
Analyzing the chart on the daily time frame, we see that BNB appears to have completed a classic correction pattern almost perfectly. The price retraced down to the 0.618 Fibonacci level (the $824–$825 zone) and has shown a clear reaction from this area. This zone has historically acted as strong support and is considered a key “pivot level” where trend reversals often begin.
The $796 level represents the lower boundary of the correction and remains critical. As long as the price stays above this region, the likelihood of the current rebound continuing remains high.
The first major target sits at $909, which aligns with both horizontal resistance and a mid-trend reaction zone. A strong breakout from this level could accelerate momentum, opening the door for the next significant resistance at $1002.
However, if $796 is lost, the correction could deepen toward the 0.79 Fibonacci level — the $715 zone. However, the current structure suggests that the strong reaction from the primary Fibonacci support area carries more weight.
In summary, BNB is showing early signs of recovery after reacting to the main Fibonacci support band. As long as the price holds above $796, the bullish targets remain in play.
These analyses, not offering any kind of investment advice, focus on support and resistance levels considered to offer trading opportunities in the short and medium term according to the market conditions. However, traders are responsible for their own actions and risk management. Morover, it is highly recommended to use stop loss (SL) during trades.


