
BCH Technical Analysis
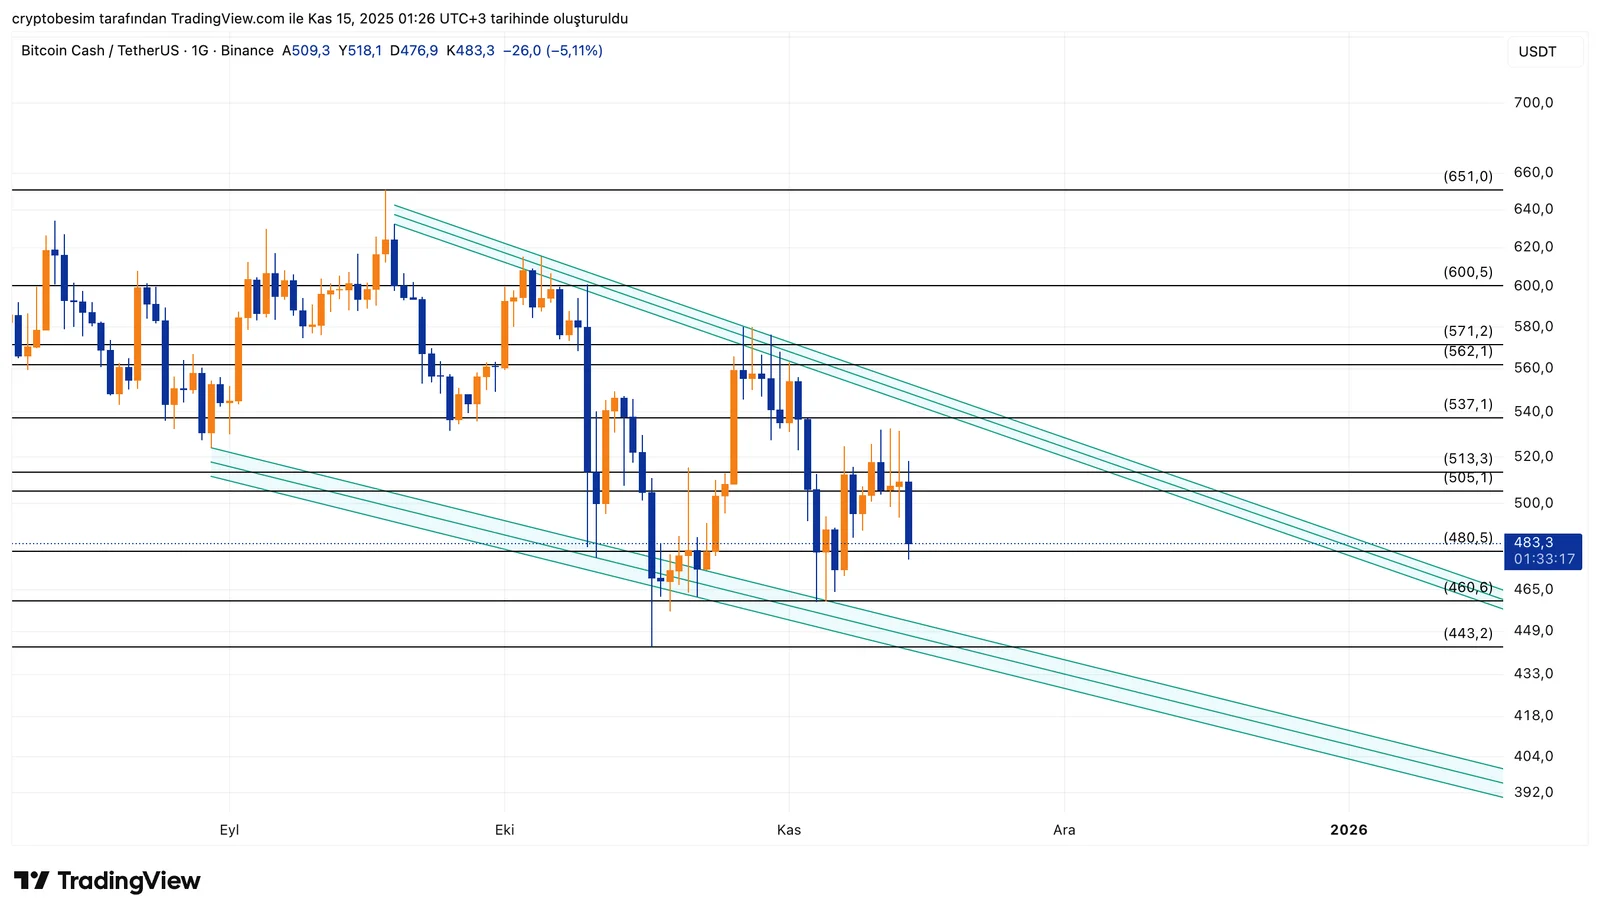
Analyzing the chart we see that the price has been moving inside a narrowing structure since September, creating both lower highs and lower lows. This isn’t a flat drop; it’s a classic falling wedge that keeps getting tighter.
The lower line of the wedge has given strong reactions in its last two touches. The upward moves haven’t turned into a full breakout yet, but each time buyers step in more strongly. This is a good sign that the pattern is working.
The upper line of the wedge is currently around the $505–$513 zone. If the price can break above this area with strong volume, the breakout will be confirmed, and a sharp upward move can follow, as the pattern suggests.
In falling wedge patterns, the target usually reaches back to where the decline initially began. For BCH, this zone is $562–$571.
If this level is cleared, the chart opens room toward:
- $600–$605
- and later the next resistance at $651.
Short-term targets are:
- $505
- $537
- $562.
The lower band of the wedge is still holding, but a retest is always possible. This support area is between $460–$443. Small dips into the lower band do not break the pattern; they’re actually common behavior in wedges.
However, if the price closes below $443 and stays there, the pattern weakens and the structure may turn back into a broader downtrend channel.
These analyses, not offering any kind of investment advice, focus on support and resistance levels considered to offer trading opportunities in the short and medium term according to the market conditions. However,traders are responsible for their own actions and risk management. Morover, it is highly recommended to use stop loss (SL) during trades.


