ARB/USDT Technical Analysis
Arbitrum continues to be one of the most active networks among Ethereum scaling solutions in 2025. Today, more than 1,000 projects are operating on Arbitrum, and the network has turned into a major liquidity hub with over 20 billion dollars in TVS (Total Value Secured). This shows that there is intensive usage across the ecosystem. In addition, important stablecoins such as PayPal USD have been integrated into Arbitrum, allowing the network to play a broader role in DeFi and multi-chain applications.
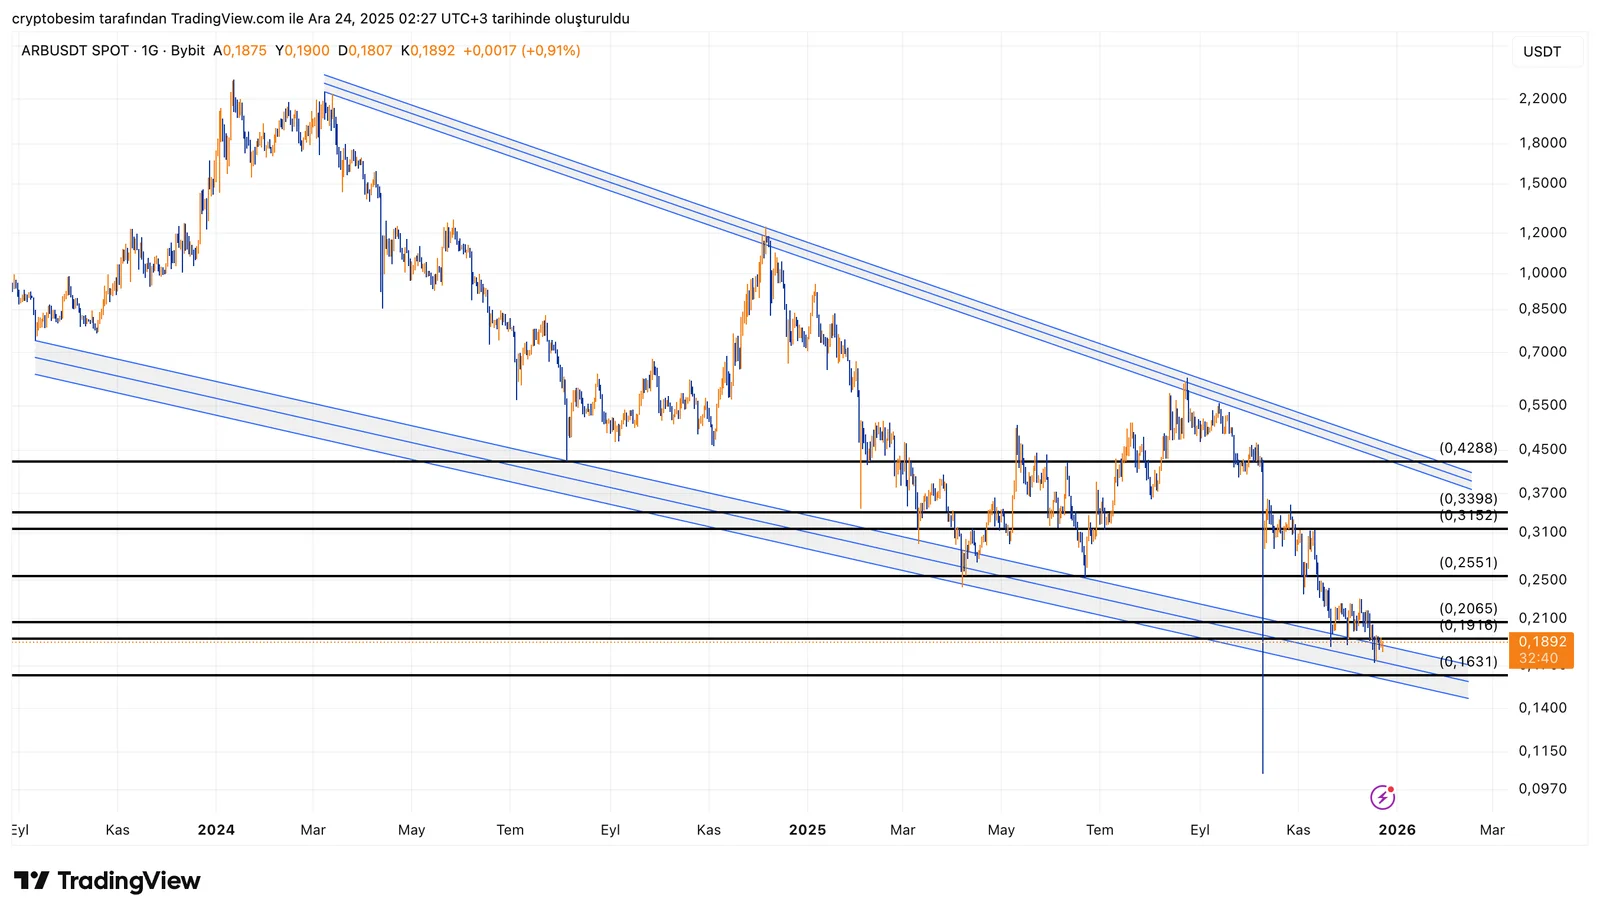
On the ARB side, the structure is read as a higher-timeframe descending wedge, and the price is currently squeezed at the lower band of this structure. Despite the prolonged declines, the weakening momentum at recent lows indicates that, as required by the formation, selling pressure is gradually being exhausted. In other words, the structure is still downward-sloping, but the decline is no longer as aggressive as before.
In the short term, the main area where the price is holding:
- 0.19 – 0.18 band
This area is a critical balance zone since it is both where recent lows were formed and close to the lower line of the wedge. As long as this level is preserved, the descending wedge formation remains valid and the possibility of an upward resolution stays on the table.
On the upside, the first important area to watch:
- 0.21 – 0.22
This is a short-term horizontal resistance and also the first relief zone. If this level is surpassed, the price is expected to move toward the mid-band of the wedge. After that, the main decision point:
- 0.32 – 0.34
This region corresponds to the upper trend of the descending wedge. When the price reaches this area, it will be at a critical threshold in terms of both the formation target and structural breakout. If a high-volume breakout occurs, the descending wedge resolves upward and the price may find a more comfortable path toward the 0.31 – 0.34 band.
In the downside scenario, the level to pay attention to is clear:
- Closes below 0.15
In this case, the descending wedge breaks downward and the risk of a slide toward the 0.12 – 0.11 band increases. If this region is lost, the structure weakens significantly.
These analyses, which do not provide investment advice, focus on support and resistance levels that are thought to create short- and medium-term trading opportunities depending on market conditions. However, the responsibility for trading and risk management belongs entirely to the user. In addition, it is strongly recommended to use stop loss for the positions shared.


