
ARB Technical Analysis
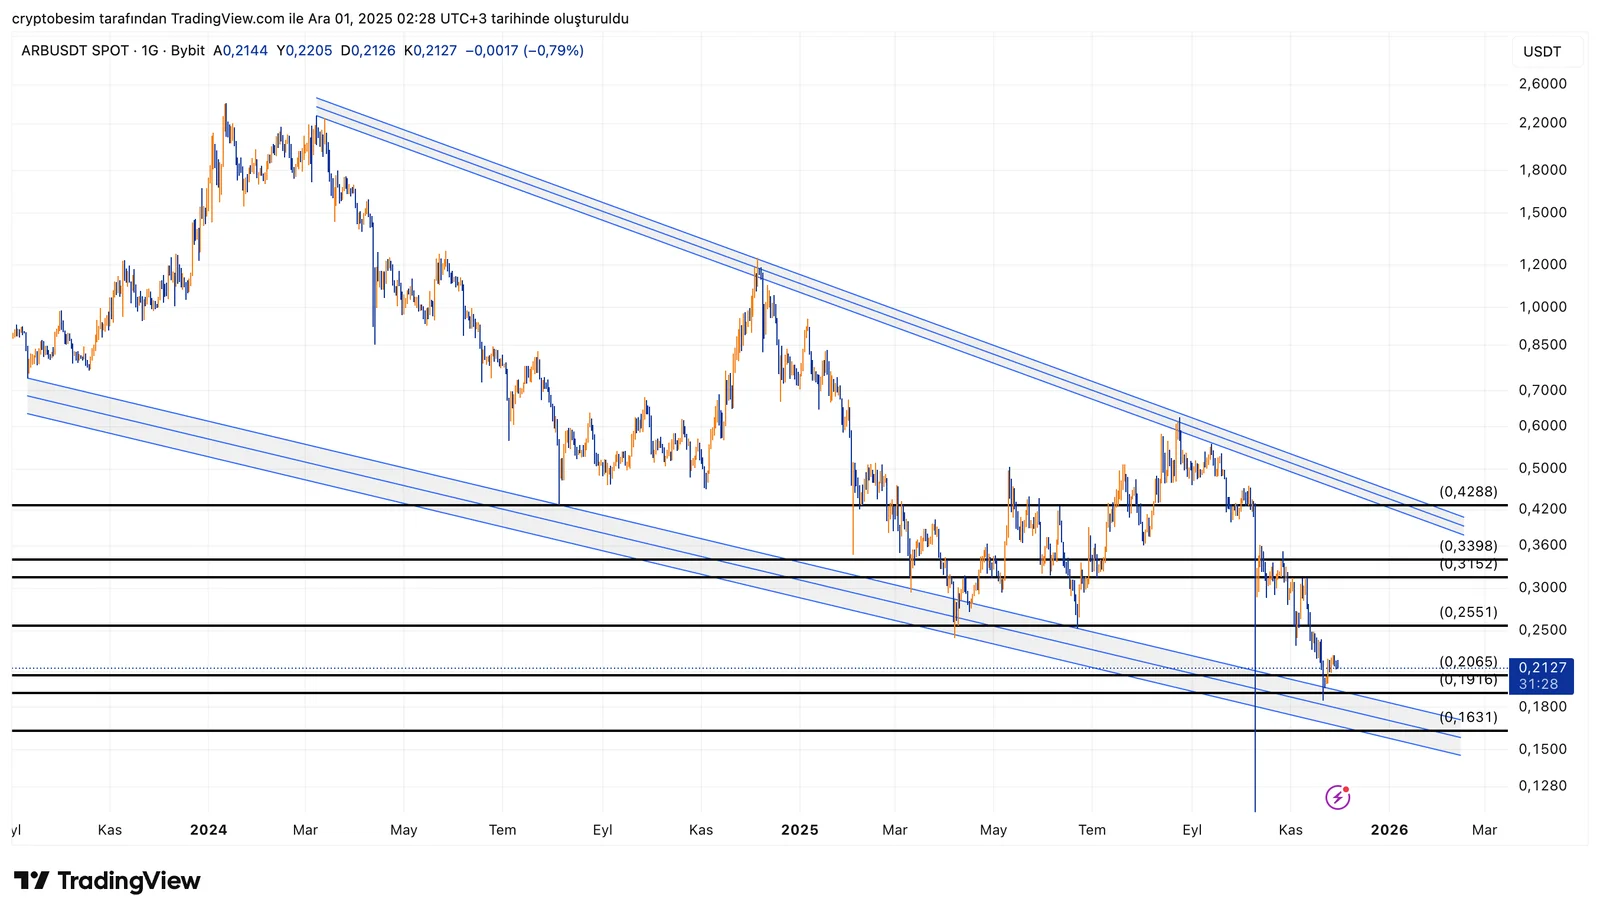
Analyzing the chart on the daily time frame, we see that ARB is trading in a very clear falling wedge structure, and the price has now touched the lower band of the wedge. This area is typically where technical rebounds and potential trend reversals often begin.
Each touch to the lower trendline signals weakening selling pressure and the possibility that the distribution phase is nearing its end. The current price action reflects this: ARB is trying to hold within the 0.19–0.21 zone, and as long as this region is not broken downward, the probability of an upward recovery remains strong.
Short-term outlook:
- If ARB holds above 0.21, it may attempt a move toward the midline of the wedge, around the 0.25 level.
- A breakout above this area opens the way toward the upper trendline of the wedge, which corresponds to the 0.33 – 0.36 range.
- If the upper band is broken, the full target of the wedge formation comes into play, pointing toward the 0.42 – 0.43 region in the medium term.
Downside scenario:
- A daily close below 0.19 may drag the price down toward the next support at 0.16, even if it does not invalidate the wedge structure.
- However, even this lower area still remains within the broader falling wedge, meaning the larger pattern would still be intact.
These analyses, not offering any kind of investment advice, focus on support and resistance levels considered to offer trading opportunities in the short and medium term according to the market conditions. However, the user is responsible for their own actions and risk management. Morover, it is highly recommended to use stop loss (SL) during the transactions.


