Altcoin
This page lists the latest Altcoin news and market analysis. Browse articles, expert insights, and updates in this category on JrKripto. Stay informed with in-depth coverage of cryptocurrency trends and developments.
News
Altcoin News
Altcoin News
Browse all Altcoin related articles and news. The latest news, analysis, and insights on Altcoin.
Bitcoin Price Hits New Record, Altcoins Gain Momentum: What's Next?
Bitcoin reached an all-time high of $124,130 in the early hours of Thursday morning. According to market data, the rally, which began from an intraday low of $119,000, surpassed the previous record of $123,300, pushing the total value of the cryptocurrency market to its highest level in history. Premium trading on some exchanges (Coinbase, Bitstamp) pushed the price even higher, with records of $124,130 also on the horizon. According to experts, BTC has gained 3.4% in the last 24 hours and approximately 8% in the last week. This momentum is driven by easing global trade tariffs and increasing expectations of a September interest rate cut due to high core inflation in the US. With this rise, Bitcoin's market capitalization reached $2.46 trillion, surpassing tech giant Google (Alphabet) to become the world's fifth-largest asset. Analyst Rekt Capital emphasized the critical $126,000 level, stating that this level could open the door to a strong breakout. Venture capitalist Chris Burniske predicted a peak for Bitcoin in October, predicting that "BTC could reach $142,690." Burniske claimed that Ethereum could reach $6,900-8,000 during this cycle, while Solana could reach $420.BTC Markets analyst Rachael Lucas emphasized that the influx of institutional capital was driving the record highs: "Public and private companies, as well as sovereign wealth funds, currently control 3.64 million BTC, representing more than 17% of the total supply."Ethereum and the altcoin frontEthereum also maintained its strong performance, reaching a four-year high of $4,770. This level is only 2.5% away from its all-time high of 2021. Rekt Capital stated that Ethereum could enter a period of price discovery if the $4,630 level becomes support. Bitcoin dominance falling below 60% has been interpreted as a sign of the start of altcoin season.Selling Pressure from Long-Term InvestorsHowever, blockchain data shows that more than 300,000 BTC has been withdrawn from long-term wallets in the last four weeks. Some wallets that had been dormant for years have become active and profit-taking. Glassnode reported that these sales, which reached record levels in July, continued, albeit at a slower pace in August.Sam Gaer of Monarq Asset Management said, “While supply from older wallets limited the price increase, the market largely absorbed this pressure.” Furthermore, institutional investors selling call overwriting options at high prices has pushed volatility to historic lows.Analysts note that a strong demand base has formed at $118,000 and that macroeconomic conditions remain supportive. Sentora's Gabriel Halm stated that 1.88 million addresses bought 1.3 million BTC at an average price of $118,000, preventing sharp pullbacks. Vtrader founder Steve Gregory stated that Ethereum investors could capitalize and return to Bitcoin, which could support a sustained price above $120,000.

Google's Play Store Policy Raises Crypto Community
Google's recently implemented Play Store policy change sparked widespread backlash among cryptocurrency developers and privacy advocates. By requiring licenses for wallet apps, the company failed to distinguish between custodial and non-custodial models. This risked effectively banning many non-custodial wallets in the US and EU, despite not being legally required to do so. Following the outcry, Google clarified that non-custodial wallets were excluded and promised to amend the policy.Requirements Exceed US Legal FrameworkAccording to the initial policy, all wallet developers in the US were required to obtain FinCEN's Money Service Business (MSB) registration and a state-by-state "money transmitter license." This effectively extended the anti-money laundering (AML) and know-your-customer (KYC) requirements imposed on banks to all wallet apps. However, FinCEN's 2019 guidance clearly stated that non-custodial wallets, which do not hold or transfer user funds, are exempt from this classification. Although not legally required, the policy would force small developers to leave the Play Store and restrict users' access to privacy-focused tools. Risk of a de facto ban in the EU conflicting with MiCAOn the European Union side, Google's policy appeared to align with the "Crypto Asset Service Providers" (CASP) licensing system defined under MiCA. However, the CASP definition covers organizations that issue, exchange, or store digital assets. Because non-custodial wallets did not meet these criteria, obtaining a license was practically impossible. This meant they were removed from the EU Play Store. The only exception was if such wallets were distributed through a licensed CASP, which would have concentrated the market in the hands of large, regulated players. FATF Impact and “Commercial Regulation”The policy approach was very similar to the broader comments in the FATF’s 2021 guidance. The FATF had proposed that some non-custodial software developers involved in processes such as user interfaces, even if they don’t technically provide storage, be considered “Virtual Asset Service Providers.” While the FATF guidelines are not legally binding, member states can face sanctions if they fail to comply. Google’s inclusion of these standards in its app store rules has been characterized by critics as “commercial regulation.”Why are they important for decentralization and privacy?Non-custodial wallets are a cornerstone of the crypto ecosystem’s principle of “financial sovereignty.” These tools allow users to control their own keys and conduct transactions without relying on third parties. Applying bank-specific licensing regimes to these software could eliminate small projects and limit consumer options to strictly regulated applications with KYC requirements. This would be a major setback for innovation and privacy. Google's decision to backtrack and exempt non-custodial wallets from licensing is a positive development. However, this incident demonstrates that not only governments but also large tech companies can influence freedom of access and use in the crypto space. The infiltration of FATF-like frameworks into private sector policies could be seen as a sign that developers and users may be forced to fight the same struggle for privacy and autonomy, but on different fronts.

STRK Comment and Price Analysis - August 13, 2025 | JrKripto
STRK/USDT Technical AnalysisSTRK has finally broken above the falling wedge formation it has been trading in for a long period. The price of the coin has now reached the first resistance zone of $0.153 - $0.162 which worked as a strong resistance and support area in the past.In case the price continues to rise after the breakout, it can be expected to test upper resistance levels gradually. The levels of $0.190 and $0.222 are key resistance levels to follow in the short and mid term.In order for the upward momentum to continue, it is important that the price of the coin hold above the level of $0.153, below which we should be following the support levels of $0.128 and $0.101. STRK Current Fracture Summary:Falling wedge formation has been broken upward.The price meets resistance level of $0.153 – $0.162.If this resistance gets broken, the targets to folow are $ 0.190→ $0.222 → $0.235 → $0.280.Support levels in case of a pullback are $0.128 → $0.101.If the breakout gets confirmed , the target of the formation in the mid term is $0,28 These analyses, not offering any kind of investment advice, focus on support and resistance levels considered to offer trading opportunities in the short and medium term according to the market conditions. However,traders are responsible for their own actions and risk management. Morover, it is highly recommended to use stop loss (SL) during trades.
What is Raydium (RAY)?
Raydium, a name we've been hearing a lot about lately, is a popular decentralized exchange (DEX) and automated market maker (AMM) protocol within the Solana ecosystem. In this guide, we'll answer questions like what Raydium is, how it works, what Ray coin is, and what the RAY token is used for, as well as examine the platform's history, features, and use cases in detail. Leveraging Solana's high-speed blockchain infrastructure, Raydium DEX aims to offer users low transaction fees and fast transaction confirmations in cryptocurrency exchanges. Furthermore, Raydium integrates with the order book of the decentralized exchange Serum, providing deeper liquidity and a unique trading experience.Raydium's Definition and OriginRaydium is a DEX and AMM protocol launched on the Solana blockchain in 2021. Standing out among Solana DEXs, Raydium enables token swaps using automated market maker pools and accesses centralized order book liquidity through its integrated Serum integration. This approach makes Raydium a platform that isn't limited to its own pools but can share liquidity throughout the ecosystem. As a result, Raydium users can experience super-fast and low-cost trading by leveraging the Solana network's high performance, which can process thousands of transactions per second.Development for the project began in late 2020, and the Raydium mainnet officially launched in February 2021. Raydium stood out as the first AMM platform to integrate directly with Serum DEX. This allows cryptocurrencies in Raydium pools to be reflected as orders on the centralized limit order book on Serum (the current community version, OpenBook). Raydium's vision was to leverage Solana's high transaction capacity to provide efficient returns for liquidity providers and to create an environment where traders could execute fast, low-slippage transactions. In short, what is Raydium Solana? It's an innovative and high-performance DEX protocol that combines both the AMM model and the order book mechanism for DeFi applications on the Solana network.Raydium's History: Key MilestonesSince its launch, the Raydium project has made many significant strides and progress within the ecosystem. Below, we've summarized the key milestones in Raydium's history chronologically:February 2021: The Raydium mainnet launch took place. The RAY token was released (Ray coin's release date is this month). RAY, the platform's native token, began playing a role in liquidity mining rewards and ecosystem usage from day one. Distribution of the RAY token. Source: Raydium/Docs 2021: Many new features were added to the platform within the first year. The Fusion Pool concept was introduced in March 2021. So, what is a Fusion Pool? In short, they are joint reward farming pools that allow different projects to incentivize liquidity pools on Raydium with their own tokens. Also in early 2021, Raydium launched its launchpad platform, AcceleRaytor (April 2021). With AcceleRaytor, token sales (IDOs) for new Solana-based projects began on Raydium. At the same time, yield farming opportunities were introduced on Raydium; users began earning RAY tokens by funding liquidity pools and staking their LP tokens. This made Raydium a significant attraction in the rapidly growing Solana DeFi ecosystem.2022: In its second year, Raydium continued to strengthen its technical infrastructure and ecosystem integrations. In March 2022, the Raydium V2 platform update was released, improving the user interface and improving performance. Serum integration was strengthened, and Raydium's liquidity pools continued to contribute more effectively to the Serum (OpenBook) order book. This enabled Raydium to offer liquidity not only to its own users but also to users trading through other DEX interfaces on Solana. Throughout 2022, many new projects were pre-sold through Raydium's AcceleRaytor launchpad, making the platform one of the first-choice IDO platforms for projects on Solana. Towards the end of the year, Raydium launched beta testing of its concentrated liquidity (CLMM) model, testing its ability to concentrate liquidity within specific price ranges (a feature considered important because it provides lower slippage and more efficient capitalization).2023: The Raydium team began taking steps toward decentralized governance. Community-driven governance principles were announced in 2023, and governance proposals were opened for discussion on the platform, allowing RAY token holders to vote. As part of this effort, Raydium adopted the goal of gradually transferring project management to the community. Furthermore, the RAY token staking program was expanded, encouraging more users to stake their RAY. RAY stakers began earning passive income by sharing protocol fees and gaining a voice in governance. All these developments strengthened Raydium's position within the ecosystem.2024: As the Solana DeFi ecosystem matured, Raydium became one of the largest AMM DEXs. By 2024, the platform single-handedly accounted for a significant portion of the total DEX trading volume on the Solana network. Raydium emerged as one of the leading protocols on Solana in terms of daily trading volume and total value locked (TVL). The deep liquidity and fast trading experience offered by Raydium, in particular, made the platform a popular choice for both institutional and individual traders. The Raydium V3 interface update, released in 2024, introduced mobile compatibility, advanced analytics tools, and new liquidity pool types (e.g., constant product market maker pools). All these innovations strengthened Raydium's competitiveness and established a strong presence in the Solana-centric DeFi world.Why Is Raydium Valuable?Raydium has a number of features and advantages that distinguish it from similar DeFi protocols and make it valuable. Let's examine the key value propositions of the Raydium DEX platform below:High Speed and Low CostRaydium is extremely fast and inexpensive because it processes its transactions on the Solana blockchain. The Solana network's capacity of over 50,000 transactions per second and negligible transaction fees of 0.0001 SOL on average allow Raydium users to trade without the high gas fees and network congestion seen on networks like Ethereum. This allows traders to experience instant execution of their orders and minimize slippage. Due to these features, Raydium has hosted volumes exceeding $120 billion, as will be seen below. AMM and Order Book IntegrationUnlike many AMM protocols, Raydium offers a hybrid model that combines liquidity pools with a central order book. The platform's smart contracts automatically place orders on the Serum/OpenBook central limit order book using assets from the liquidity pools. This means that liquidity on Raydium can also be used by other Serum interfaces within the Solana ecosystem. As a result, Raydium contributes to a broad ecosystem-wide liquidity network, rather than being a siloed AMM. This integration offers users the best of both worlds: it combines the continuous liquidity of AMMs with the depth and price stability of order books. For example, a user who swaps on Raydium gains access not only to the liquidity available in Raydium pools but also to the liquidity available on OpenBook. RAY token use cases (farming, staking, governance)Raydium's native cryptocurrency, the RAY token (Ray coin), serves several important functions within the platform. First, users who provide liquidity can earn RAY token rewards through farms. In Raydium's yield farming model, users who add assets to a liquidity pool consisting of two tokens receive LP (Liquidity Provider) tokens and stake these LP tokens in Raydium's farming pools to earn RAY rewards. Second, staking RAY tokens earns additional income and privileges. When users unilaterally lock (stake) their RAY tokens on the platform, they earn passive returns by receiving a share of the platform's transaction fees.As per Raydium's fee mechanism, 0.22% of the 0.25% fee received for each swap is distributed to liquidity providers, while the remaining 0.03% is used to purchase RAY tokens from the market; this buyback mechanism provides indirect returns for stakers. The third important use case is governance. RAY token holders have the right to participate in platform governance and vote on proposals in the future. Raydium has designed RAY as a governance token to transition to a community-based structure, giving RAY holders a say in important protocol updates, fee changes, or new feature additions. In short, the answer to the question of what the RAY token does is that it's a versatile platform token that offers users farming, staking rewards, and governance rights.Accessing new projects with AcceleRaytor (launchpad)Raydium's launchpad feature, called AcceleRaytor, allows users to participate in early-stage sales of new projects on Solana. Raydium users have the opportunity to purchase tokens from promising projects before they even list by participating in IDOs conducted through AcceleRaytor. Furthermore, Raydium offers two types of IDO pools: Community Pool and RAY Pool.While community pools are open to the public, participation in RAY pools requires a certain amount of RAY tokens to be staked on the platform beforehand. This mechanism aims to reward the Raydium community and create demand for the RAY token. For example, the initial AcceleRaytor projects required a minimum stake of 20 RAY to participate in the RAY pool. Through Launchpad, Raydium provides both capital and liquidity support to new projects in the ecosystem and offers its users early investment opportunities with high potential for profit. AcceleRaytor A liquidity hub in the Solana ecosystemRaydium is a cornerstone of the growing Solana DeFi ecosystem. Through both its technical integrations and its diverse product offerings, it provides liquidity and infrastructure support to other protocols on Solana. For example, many Solana-based wallets and applications utilize Raydium's liquidity pools as the backend for token swaps. Raydium's deep liquidity and high volume contribute to stable price discovery on the Solana network.By 2024, Raydium became one of the largest DEXs not only on Solana but across all chains in terms of daily trading volume. In fact, during certain periods, Raydium's trading volume surpassed PancakeSwap on the BSC network, ranking second globally behind Uniswap. The difference between various DEXs and Raydium can be illustrated as follows:Feature / PlatformRaydiumOrcaJupiterLifinityTransaction SpeedVery high (Solana infrastructure, ~400ms block time)HighHighHighTransaction Fee~0.25% (0.22% to LP, 0.03% buyback)~0.3%Variable (depends on routes)~0.15%Liquidity ModelAMM + Order Book (Serum/OpenBook integration)AMM (Concentrated + Stable Pools)Route aggregator (sources liquidity from multiple AMMs)AMM (Proactive market maker)Launchpad SupportYes (AcceleRaytor)NoNoNoStaking AvailabilityYes (RAY staking)Yes (ORCA staking)NoYes (LFNTY staking)Fusion Pool / Special FarmingYesNoNoNoLiquidity VolumeHigh (Leader on Solana in 2024)Medium-HighHigh (due to aggregator model)MediumUser InterfaceAdvanced, V3 interface + analytics toolsSimple and user-friendlySimple (swap-focused)Advanced (charts, automated settings)Who is the Founder of Raydium?Raydium was developed by a decentralized team, and the names of individual founders have not been disclosed to the public. The core team behind the project has chosen to remain anonymous, presenting themselves under pseudonyms such as AlphaRay, XRay, GammaRay, StingRay, and RayZor. This development team consists of experienced individuals from diverse fields, including algorithmic trading, blockchain development, marketing, and mathematics. The Raydium team built the protocol in close collaboration with the Solana and Serum communities. In mid-2020, the team rolled up their sleeves to address the shortcomings they saw in the DeFi space and implemented the idea of an AMM integrated with Serum as a solution. The result is the Raydium platform we know today. Over time, the project's governance has transitioned to a community-driven governance model; RAY token holders have begun to have a say in decisions about the platform's future. In short, there is no clear answer to the question, "Who owns the Ray token?" because Raydium is not owned by a single founder, but rather is collectively owned by the community and the development team. Frequently Asked Questions (FAQ)Below are some frequently asked questions and answers about Raydium:What is Raydium and how does it work?: Raydium is a Solana-based decentralized cryptocurrency exchange (DEX) and automated market maker (AMM) protocol. Users can swap tokens without any intermediaries by connecting their wallets on Raydium. Raydium's operating system integrates the AMM model, which sets prices using assets in liquidity pools, with Serum's central order book. This allows Raydium to execute fast, low-cost, and low-slippage transactions by drawing liquidity from both its own pools and the wider ecosystem.What is the RAY token used for?: The RAY token is the native cryptocurrency of the Raydium platform and is used for various purposes. First, yield farming rewards are awarded in RAY tokens; users can earn RAY by adding liquidity to pools and staking LP tokens. Users who stake RAY tokens also earn passive income by sharing the platform's transaction fees and qualify for token sales on the AcceleRaytor launchpad. In the long term, RAY will also serve as Raydium's governance token, meaning RAY holders will be able to vote on the platform's future.What is the relationship between Raydium and Serum?: The relationship between Raydium and Serum (OpenBook) is one of Raydium's most distinctive features. Raydium's smart contracts place orders from liquidity pools into Serum's central limit order book (CLOB). This means that the liquidity in Raydium pools is also accessible to other users on Serum. When a user swaps tokens through Raydium, the transaction is reflected in Serum's order book in the background, and the best price is matched on whichever platform is available. Thus, Raydium and Serum share liquidity; Raydium liquidity providers see greater trading volume, while Serum traders benefit from the liquidity of AMM pools. In short, Raydium has integrated with Serum's infrastructure, creating a unique AMM + order book hybrid within the Solana ecosystem. How is yield farming done on Raydium?: Earning RAY tokens through yield farming on the Raydium platform is a very user-friendly process. First, you become a liquidity provider by depositing two tokens (such as the RAY-USDC or SOL-RAY pair) in proportional values into one of Raydium's liquidity pools. When you add liquidity, you receive pool share tokens, called LP tokens, in return. Then, you go to Raydium's "Farms" tab and stake your LP tokens in the relevant farming pool. As a result of this staking process, the protocol accumulates your share of RAY rewards over time. You can collect or withdraw your rewards at any time. Some special pools on Raydium are called Fusion Pools, and in these pools, in addition to RAY, you can also earn token rewards from partner projects. In short, yield farming is an important way to generate passive income by providing liquidity on Raydium. What is AcceleRaytor and how to participate? AcceleRaytor is a launchpad, or pre-sale, provided by the Raydium platform for new projects. This feature allows promising projects on the Solana network to raise capital by pre-offering their tokens to Raydium users. To participate in AcceleRaytor events, you must connect your wallet to the AcceleRaytor page on Raydium's website during the announced IDO (Initial DEX Offering) dates and contribute, usually in USDC. While participation requirements vary by project, there are typically two pool options: the Community Pool and the RAY Pool. The Community Pool is open to anyone and typically requires fast action (first-come, first-served). The RAY Pool, on the other hand, is only open to users who have staked a set amount of RAY tokens for a specific period. For example, a project may require staking at least 100 RAY for seven days to qualify for the sale. With this structure, Raydium grants privileges to loyal RAY token holders in early sales. As a result, AcceleRaytor provides both a secure IDO environment for projects and provides users with early access to high-potential projects.How to stake RAY tokens: Staking RAY tokens on the Raydium platform is quite simple. First, you need to connect a Solana-compatible wallet (e.g., Phantom) to the Raydium app. Then, in the Raydium interface, navigate to the "Staking" or "Pool" section and find the one-sided staking pool designated for RAY (usually listed as "RAY Staking"). Confirm the staking by depositing your RAY tokens into this pool. Once the transaction is confirmed, your RAY tokens are locked, and you can begin staking immediately. During your staking period, RAY rewards from the platform's protocol revenues and buyback mechanism will accumulate in your account. You can withdraw your rewards at any time using the "Harvest" button or choose to accumulate them for a longer period. RAY staking is flexible; you can exit staking and withdraw your invested RAY at any time (although in some cases, there may be a waiting period or a small penalty mechanism on rewards; it's worth checking the current Radillam documentation for details). By staking RAY tokens, you both earn passive income and take the first step toward having a say in the platform's future.For more content on Raydium and Solana-based DeFi applications, follow our JR Crypto Guide series.
SUI Comment and Price Analysis - August 13, 2025 | JrKripto
SUI Technical AnalysisLooking at the SUI chart, we see a rising channel chart from a wide angle. It is currently trading in the middle band of the channel. Looking at its short-term movements, we can say that the positive market structure continues. After the last bottom contact, that is, the last contact with the lower trend of the channel formation, it formed a new high, and now the lower trend zone is in a positive area.Looking at horizontal support and resistance levels, we see that the $3.59 support is of great importance. In the event of a break below this support, the $3.22-$3.32 support area should be monitored. The lower trend line of the channel also intersects with the aforementioned support zone on average. We see that the trend could extend the support area to $2.94.In upward scenarios, we see that the $4 level creates psychological resistance. If this level is broken and we see a move to the $4.29 resistance level, we expect it to break above this peak. Breaking through this resistance level could quickly lead us to the $5.11 level. Currently, the $3.59 support and $4.29 resistance levels will be closely monitored. SUI Rising Channel Summary:The price is trading near the mid-range within a broad ascending channel structure.The $4.29 level is acting as strong resistance.The $3.59 support level is a key short-term level.If it can sustain above $3.59, the $5 region could be targeted.In the event of a pullback, the $3.32, $3.22, and $2.94 support levels should be monitored.These analyses do not constitute investment advice and focus on support and resistance levels that may present potential trading opportunities in the short and medium term, depending on market conditions. However, the responsibility for executing trades and managing risk lies entirely with the user. It is also strongly recommended to use stop-loss orders for any trades mentioned.
Meme Coin Platform Hit by $7 Million Bitcoin Hack
Odin.fun, a Bitcoin-based meme token launch and trading platform, lost approximately 58.2 BTC (approximately $7 million) due to a critical vulnerability in its liquidity automated market maker (AMM) system, which was implemented in its latest update. Company CEO Bob Bodily stated that the vulnerability was exploited by China-based groups, and that funds were withdrawn from the platform within two hours. The incident first came to light after a member of the Odin.fun community noticed it. In a post on social media platform X, Bodily admitted that the company's treasury could not cover the magnitude of the loss alone. This statement fueled concerns within the community about the platform's future.Bodily stated, "The remaining funds on the platform are safe," and announced that a top-tier security firm had been assigned to audit all code.The vulnerability was revealed in the latest update.According to the CEO, the attack stemmed from a vulnerability in Odin.fun's liquidity AMM mechanism, which enables decentralized token swaps. However, a bug added in a recent update allowed attackers to withdraw BTC without depositing the equivalent asset by manipulating trading pairs.Bodily stated that several groups with connections to China quickly discovered the vulnerability, withdrawing a significant amount of BTC from the platform and transferring it before the vulnerability was discovered. Withdrawals were immediately halted once the issue was identified.The company contacted OKX and Binance to trace the stolen funds. Both exchanges began coordinating with Chinese authorities. US law enforcement was also involved in the process.A clear warning to attackersBodily sent a direct message to the groups it claimed were involved in the attack:“You have a short time to return the funds. This is not a negotiation. Most of you have already been identified, and we will use all necessary time and resources to recover the stolen assets.”This isn’t the first security breach Odin.fun has faced. In April, the platform temporarily suspended withdrawals due to a vulnerability in its “Login with Bitcoin” feature. While the vulnerability was quickly patched at the time, the latest attack is much larger and has severely shaken user trust.While Odin.fun hasn't yet announced a clear compensation plan, Bodily stated, "We are working on a concrete plan to compensate everyone affected." He stated that despite the limited funds, they aim to compensate all users. The CEO stated that they are also considering alternative recovery strategies, but will not provide details at this time.Bodily claimed that despite the incidents, Odin.fun is the fastest-growing platform in the Bitcoin DeFi space and maintains its leading position. The company plans to utilize blockchain analysis, collaboration with major exchanges, and international legal processes to trace the stolen funds.
New Ethereum Forecast from Standard Chartered: 3X Higher
Standard Chartered has significantly revised its price targets for Ethereum (ETH). The bank raised its 2025 year-end forecast from $4,000 to $7,500 and tripled its 2028 target from $7,500 to $25,000. This optimism stems from the rapidly increasing accumulation of ETH in institutional reserves.According to Bloomberg Terminal data, these new forecasts are particularly fueled by corporate adoption of Ethereum as a strategic treasury asset. Standard Chartered also cites tokenization projects, stablecoin payments, layer-2 scaling solutions, improvements in staking liquidity, and developments in institutional custody services as key drivers of the long-term rally.Institutional Ethereum reserves riseAccording to StrategicETHReserve data, the total amount of ETH held in institutional reserves (SERs) and ETFs has reached 9.9 million. This figure corresponds to approximately 8.3% of the current supply.The 71 companies and organizations within the SER hold a total of 3.57 million ETH ($16.8 billion).ETF reserves stand at 6.28 million ETH ($29.5 billion).ETFs have recorded a net inflow of 124,000 ETH in the last six days.72 institutions hold 100 ETH or more. At the top:Bitmine Immersion Tech – 1.2 million ETH ($5.41 billion)SharpLink Gaming – 598,800 ETH ($2.81 billion)The Ether Machine – 345,400 ETH ($1.62 billion)Ethereum Foundation – 232,600 ETH ($1.09 billion)PulseChain Sac – 166,300 ETH ($781.8 million)Coinbase – 136,800 ETH ($643 million)Bit Digital – 120,300 ETH ($565.6 million)Mantle – 101,900 ETH ($478.9 million)Golem Foundation – 100,700 ETH ($473.4 million)ETHZilla Corporation – 82,200 ETH ($386.4 million) (millions of dollars) The list also includes major players such as Lido DAO, Arbitrum DAO, Gnosis DAO, U.S. Government, and Aave DAO.Ethereum Price Approaching RecordETH is trading at $4,701 at the time of writing. Having gained approximately 28% in the last week, Ethereum is nearing its strongest price levels since its November 2021 peak. The first critical resistance on the technical chart is seen at $4,800. It's also worth noting that at this point, ETH is only 3.8% away from its all-time high of $4,878. The largest altcoin broke this record on November 10, 2021. This means it's nearly four years from reaching its all-time high. Standard Chartered's 2028 target of $25,000 implies a market capitalization of over $3 trillion based on current supply. However, analysts agree that institutional inflows will need to accelerate further for this to happen. ETH's market capitalization currently stands at $567 billion.

ALT Comment and Price Analysis - August 13, 2025 | JrKripto
ALT Technical AnalysisThe price continues to move within a contracting triangle formation. The upper band of the formation is between $0.0383 and $0.0398. This area serves as both the upper boundary of the triangle and strong horizontal resistance. Below, the $0.0345 intermediate support level, with $0.0311 and $0.0299 serving as major support levels. Narrowing Triangle Structure If the price breaks through the $0.0398 level with significant volume, the triangle formation will complete its upward trend, with the $0.0447 region emerging as the first target. A break above this level will technically activate the $0.0539 target in the medium term.As long as the triangle pattern holds, price action is likely to continue fluctuating within the established support and resistance range. However, a drop below $0.0299 would invalidate the formation and could open the way for a retest of the $0.0266 level.These analyses do not constitute investment advice and focus on support and resistance levels that may present potential trading opportunities in the short and medium term, depending on market conditions. However, the responsibility for executing trades and managing risk lies entirely with the user. It is also strongly recommended to use stop-loss orders for any trades mentioned.
An Altcoin in the Ethereum Ecosystem Is Ceasing Operations: Its Price Has Increased by 60 Percent
Founded in 2020 as Archer DAO to create additional income opportunities for Ethereum miners and renamed Eden Network in 2021, the project has decided to completely cease operations. The company announced this decision due to rising costs and shrinking profit margins in the highly competitive Miner Extractable Value (MEV) space.According to a statement from Eden Network, products such as Eden RPC, Eden Bundles, and Mempool Stream were immediately disabled. Users were directed to alternative platforms such as Flashbots Protect, Flashbots Bundles, and Blocknative Mempool Explorer. The company also shut down other services such as Tx Explain, Eden Public Data, and 0xProtect and shared recommended alternatives.Looking at the project's history, Archer DAO was initially launched to enable Ethereum miners to earn additional income by leveraging MEV revenues. With the implementation of the EIP-1559 update on the Ethereum network in 2021, which significantly impacted miner revenues, the project evolved into the Eden Network, focusing on both supporting miners and protecting users from the negative impacts of MEV.At its peak, Eden Network boasted miner partnerships representing over 50% of the Ethereum hash rate, and thousands of daily transactions were routed through MEV-protected RPCs. Post-Merge, the company achieved the highest average block reward as an MEV-Boost relay operator. However, over time, the maturation of the space, increasing competition, and operational costs made it impossible for Eden to maintain its market position.Altcoin Announces "Retirement Plan" The most important step in Eden Network's closure will be the distribution of 2,000 ETH to EDEN token holders. The company has set a fixed rate of 0.00001506 ETH per token for this process, which it calls the EDEN Token Retirement Program. Approximately 66,401 EDEN equals 1 ETH. A total of approximately 132.8 million EDEN will be distributed from the circulating supply, and only users outside the US can participate in this program.The program began on August 13th and will continue until September 30, 2025, at 02:59 GMT. Any unused ETH at the end of the period will be allocated to cover the company's liquidation costs. All tokens in the company's treasury that have not yet vested will be burned.Price RisesFollowing the closure announcement, the EDEN price saw a sharp rise in the markets. According to market data, the token gained over 70% in value in the last 24 hours, reaching $0.06778. This rise was driven by the anticipation of ETH distribution to token holders and short-term buying opportunities. The closure of the Eden Network highlights the challenges faced by projects operating in the MEV ecosystem. In particular, high competition and cost pressures make it difficult for small and medium-sized enterprises in this field to survive in the long term.

OKX's Massive Token Burn: OKB Soars, Other Exchange Tokens Rise Too
Cryptocurrency exchange OKX has announced a radical tokenomics update for OKB, its ecosystem's native token. The company announced that it will burn approximately 65.26 million OKB tokens at once. Following this burn, the total supply will be capped at 21 million. This development generated significant market interest, causing a surge in the OKB price.The update, announced on the morning of August 13th, triggered a feeling of FOMO (fear of missing out) among investors. OKB surged more than 170% during the day, reaching $124. According to some market data, the token briefly surged 200% to $134. Radical Change at OKXOKX announced in its announcement that more than 65 million OKB, accumulated through past buyback programs and held in company reserves, will be burned. This will significantly reduce both the circulating and total supply.In addition, the OKB smart contract will also be updated. With the update, token minting and manual burn rights will be completely removed. This move aims to permanently limit the supply and make the token economy more transparent.OKTChain is being discontinuedThe exchange's plans include shutting down its own chain, OKTChain. Existing OKT tokens will be converted to OKB based on the average closing prices between July 13 and August 12, 2025. OKTChain will continue operating until January 1, 2026.According to the timeline announced by OKX:August 13: OKT transactions are suspended.August 13: Withdrawals to OKB's ETH L1 network are closed.August 15: OKT tokens will be automatically converted to OKB.August 15: A one-time OKB burn will be conducted, followed by a permanent burn via an on-chain smart contract.August 18: The OKB smart contract will be updated, removing mint and burn rights.Impact on Other Exchange TokensThe sharp rise in OKB also positively impacted other centralized exchange tokens.Bitget's BGB token rose 15.5% to $4.97,Gate.io's GT token rose 31.1% to $19.16, andBinance's BNB token rose 2.5% to $849.Additionally, OKLink shares, a Hong Kong-listed company owned by OK Group, which is a subsidiary of OKX, rose 26.09%.
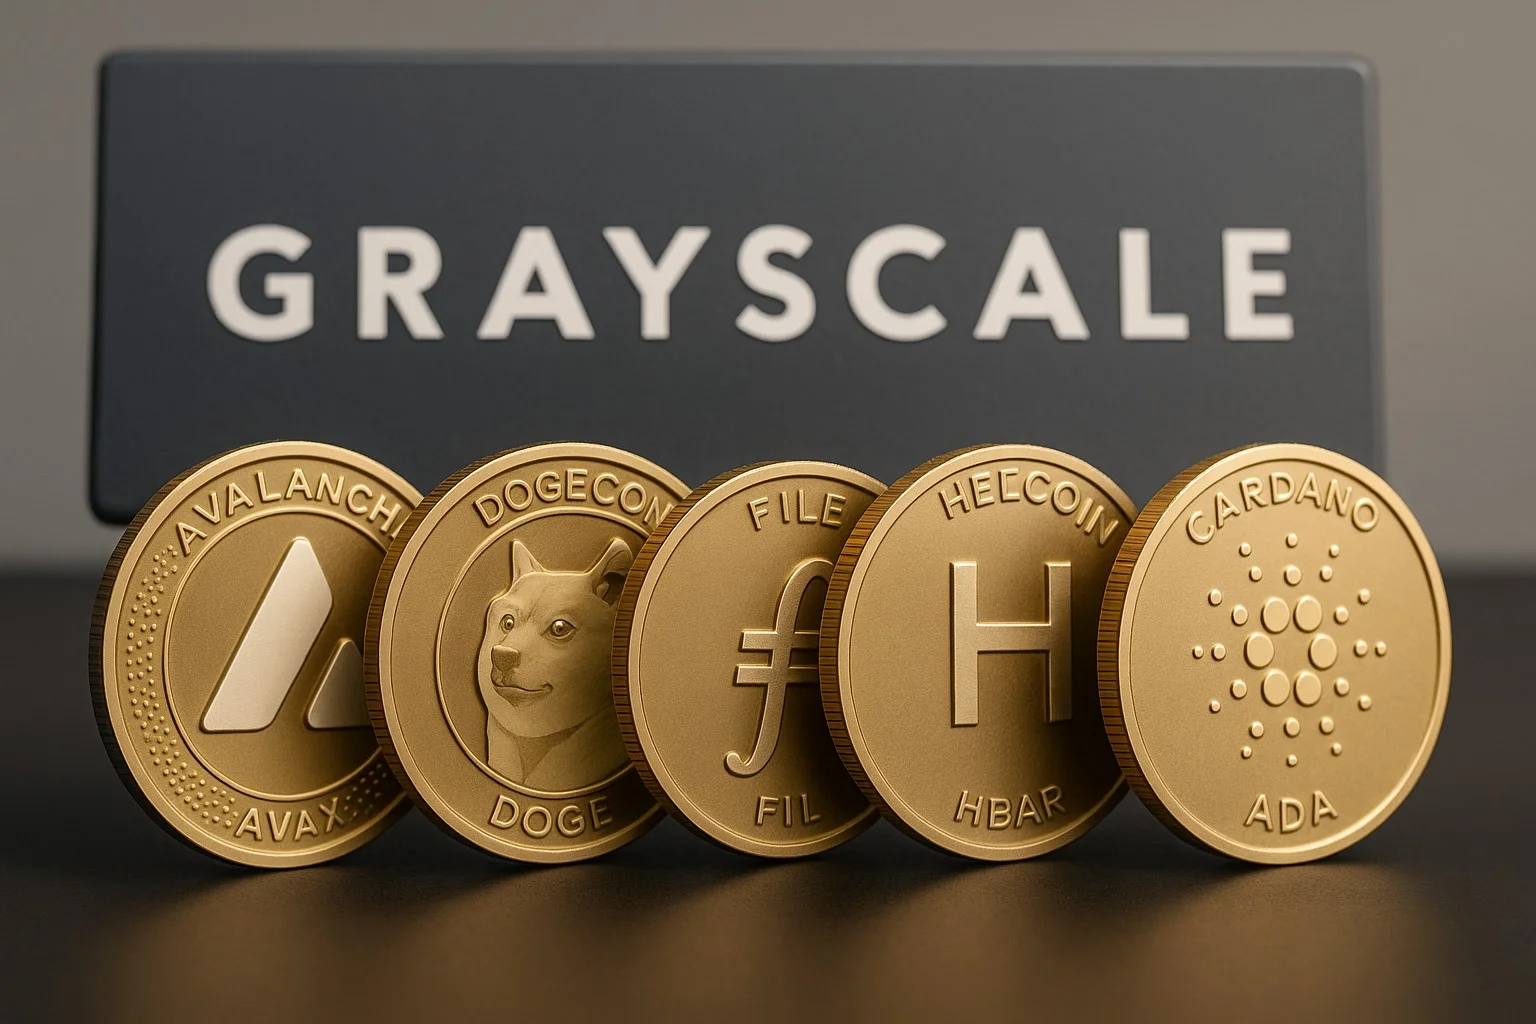
Grayscale Launches Spot ETF Preparations for Two Altcoins
Two new asset registrations, the Grayscale Cardano Trust ETF and the Grayscale Hedera Trust ETF, have appeared on the official corporate registration portal of the US state of Delaware. This development suggests that Grayscale, the Bitcoin and altcoin asset management giant, may be preparing to launch spot exchange-traded funds (ETFs) for Cardano (ADA) and Hedera (HBAR).The registrations in question are dated August 12, and both funds are listed under a general statutory trust structure. Similar registrations have typically been seen in the past prior to S-1 filings with the US Securities and Exchange Commission (SEC). S-1 filings are among the mandatory steps for an ETF to be listed on an exchange.Earlier this year, the SEC officially accepted NYSE Arca's Form 19b-4 filing for Grayscale's spot Cardano ETF and Nasdaq's form for its Hedera ETF. This acceptance marks the first phase of the regulatory review process. First Altcoin ETF RegistrationsThese new registrations mark Grayscale's first altcoin ETF trust registrations on the Delaware portal for Cardano and Hedera. The company previously held investment trust registrations for other altcoins such as Dogecoin, Filecoin, Avalanche, and Bittensor. Grayscale's existing trusts. Source: Grayscale On the same day, Grayscale also announced two new investment trusts offering investment in native tokens of the DeepBook and Walrus projects operating on the Sui blockchain ecosystem. These projects specialize in providing trading and data infrastructure.Altcoin ETF push strengthens in the USAccording to market analysts, these steps are part of an expansion strategy by US asset managers into altcoin-based ETFs. The commercial success of Bitcoin and Ethereum-based spot ETFs is increasing demand from institutional investors for regulated access to a broader range of crypto assets.While Cardano is known for its research-driven development model and emphasis on scalability, Hedera offers an alternative distributed ledger technology focused on institutional use cases. Therefore, approving spot ETFs for both assets could provide investors with secure access through traditional market structures.Positive Regulatory EnvironmentRecently, the regulatory environment in the US has been shifting in favor of these types of products. As previously reported, the SEC's approval of the in-kind redemption mechanism for spot Bitcoin and Ethereum ETFs has paved the way for increased applications for other crypto assets.Furthermore, the SEC, in conjunction with the Commodity Futures Trading Commission (CFTC), is conducting an initiative called "Project Crypto." This project aims to clarify how digital assets are classified under US law. This aims to resolve long-standing uncertainties in the sector by determining which tokens qualify as securities.Last month, Grayscale also confidentially filed an IPO with the SEC.
What is Vaulta (A)?
In the years before cryptocurrencies were as widely discussed as they are today, and Bitcoin and Ethereum dominated the market, a new project called EOS emerged. Its 2018 launch was etched in memories with the largest ICO in blockchain history, raising a staggering $4 billion. At the time, EOS was dubbed the "Ethereum killer" for its high transaction capacity, low fees, and user-friendly design. Its attractive smart contract platform for developers and ability to confirm transactions in seconds generated significant excitement in the crypto world. However, over time, the technology evolved, user expectations shifted, new blockchains entered the market, and it became difficult for EOS to maintain its former power.At this point, the community and team behind the project decided on a radical change. We're not just talking about a name change; we're talking about a complete reshaping of the vision. In 2025, EOS returned with a brand new identity: Vaulta. This transformation was like preserving the foundations of an old building and building a modern skyscraper. Vaulta is no longer just a smart contract platform; it sets out to become the banking infrastructure of the Web3 era. Its goal is to bring together traditional financial services such as payment systems, loans, insurance, and investments with decentralized applications on a single chain.At the heart of this new era is the A coin. If you're wondering, "So, what is A coin?", it's Vaulta's native token, symbol A, and the lifeblood of the network. All transactions, smart contracts, governance votes, and financial products run on this token. A special gesture was also made to the EOS community: old EOS tokens were converted into A tokens at a one-to-one ratio. This allowed existing investors to step into the new era without any losses. Leveraging its past experience and community support, Vaulta aims to open a new chapter in the financial world with speed, scalability, and innovative integrations.Now, let's take a closer look at how Vaulta came to be, its technical features, and why it's so talked about.Vaulta's Definition and OriginsEOS, one of the first projects to attract attention in the crypto world, debuted strongly in 2018, a smart contract platform built on a solid financial foundation with a massive ICO. However, as time progressed, expectations and needs shifted, and the community began to wonder, "What were we missing?" As transaction volume and usage declined, the project maintained its reliable infrastructure but was no longer as active in the market. A poster showing the EOS-Vault switch. Then, in 2025, things changed radically: The EOS Network Foundation, with a wisdom-based rebirth, unveiled the Vaulta name and vision. This wasn't just a color change; it was a true strategic pivot. Coins were converted one-to-one to the A token, a transition coordinated with major exchanges like Binance, ensuring users would not lose any assets.Behind this move was a concrete plan: Vaulta aimed to be not just a blockchain, but the core of the Web3 banking ecosystem. To this end, the Banking Advisory Council was established, and experts from organizations like Systemic Trust, Tetra, and ATB Financial came together to shape the intersections between traditional banking systems and Web3.Technically, the Vaulta infrastructure maintains the reliable blockchain architecture of EOS (C++ smart contracts, RAM-based database, IBC compatibility); However, by adding an EVM-compatible layer, exSat and Bitcoin integration, and Antelope (Spring 1.0) technologies that offer instant final confirmations, Vaulta becomes a fortress-like banking backbone.Vaulta has also attracted the attention of institutional investors. For example, World Liberty Financial has pledged $6 million in support of Vaulta out of confidence. Vaulta's WLFI partnership statement. Source: X Vaulta's History: Key MilestonesEvery major project has a history, and Vaulta's story is no different. Its journey, which began as EOS, has been a long one, marked by ups and downs in the crypto world. The intervening years have transformed both the technology and the project's goals. Let's take a look at the key moments of this transformation.2018: The EOS mainnet was launched. It raised approximately $4 billion in funding through one of the largest ICOs in blockchain history.May 2025: The EOS → Vaulta rebranding process was undertaken. Led by the EOS Network Foundation, the project name was changed to Vaulta, and a strategic focus on Web3 banking was announced. As part of this process, existing EOS tokens were converted one-for-one to Vaulta's A token through a formal token swap. The rebranding was supported by the establishment of the Vaulta Foundation and the creation of a Banking Advisory Council comprised of experts from the financial sector. June 2025: Significant technical updates went live on the Vaulta network. The Ethereum Virtual Machine-compatible smart contract platform, called Vaulta EVM, was launched on the mainnet. At the same time, the Bitcoin integration protocol, called exSat, and the Savanna consensus engine were also launched. Thanks to these innovations, Vaulta now supports both Ethereum-based smart contracts and enables financial applications integrated with the Bitcoin network. Savanna consensus reduced block confirmation time to approximately 1 second, enabling instant financial transactions.July 2025: Vaulta made significant strides in cross-chain interoperability. Integration with the Cosmos IBC protocol was completed, allowing Vaulta to transfer data and assets with other blockchains in the Cosmos ecosystem. Furthermore, the Bitcoin bridge connection was established and activated, establishing direct communication between Vaulta and the Bitcoin network. This enabled users to send and receive Bitcoin on the Vaulta platform and seamlessly transfer value between different networks.Why is Vaulta Valuable? What truly makes a project valuable isn't just its technology or name; it's the solutions it offers, the convenience it provides, and the innovations it brings to users' lives. This is precisely where Vaulta stands out. By combining the robust infrastructure inherited from EOS with the Web3 banking vision, it offers a unique experience for both developers and users. Speed, security, cross-chain connectivity, and the ability to bridge the gap between the real world and digital assets transform Vaulta from an ordinary blockchain into a powerful financial ecosystem. Vaulta's key features and advantages can be summarized as follows:1-second transaction confirmation (Savanna DPoS)By combining Delegated Proof of Stake (DPoS) consensus with the advanced Savanna algorithm, Vaulta can finalize blocks in approximately 1 second. This extremely fast confirmation time allows the network to securely process thousands of transactions per second. Thanks to its high transaction capacity and low latency, Vaulta can meet the instant payment and reconciliation needs of financial applications. Ethereum-Compatible EVMVaulta offers a smart contract layer compatible with the Ethereum Virtual Machine. Thanks to the Vaulta EVM, contracts written in Solidity and Ethereum ecosystem applications can be run on the Vaulta network without any modifications. Developers can continue to use familiar tools like MetaMask and easily port their Ethereum projects and dApps to Vaulta. Furthermore, the Vaulta EVM provides a much faster and more user-friendly experience compared to Ethereum, with a 1-second settlement time and lower costs.Bitcoin Integration (exSat Protocol)Vaulta directly interacts with the Bitcoin network through exSat integration. exSat operates as a virtual chain within the Vaulta chain, tracking Bitcoin's UTXO data. This makes it possible to integrate Bitcoin into the Vaulta ecosystem without a bridge or wrapped token. For example, decentralized finance applications collateralized by Bitcoin can be run on Vaulta, generate yields with BTC, and perform real-time BTC transfers. In short, Vaulta combines the power of BTC with smart contracts by making Bitcoin a native asset on its network. The logic behind ExSat. Source: ExSat/Docs Inter-chain communication (Cosmos IBC compatibility)The Vaulta network also excels in interoperability with different blockchain ecosystems. Thanks to its integration with the Cosmos IBC (Inter-Blockchain Communication) protocol, Vaulta can securely and quickly communicate with other IBC-compatible blockchains. This interoperability facilitates the transfer of assets between different networks and the development of multi-chain applications. For example, an asset on Vaulta can be moved to another Cosmos-based chain via IBC, and vice versa. This feature makes Vaulta an important bridge in the multi-chain world.Web3 banking infrastructureVaulta's most valuable asset is its comprehensive infrastructure that combines traditional financial services with Web3 technology. Payment systems, DeFi protocols, digital insurance (Vaulta insurance) products, and tokenized assets (e.g., tokenization of real-world assets like real estate or bonds) can be developed on the network. Vaulta's open-to-enterprise integration design allows banks and fintech companies to integrate blockchain-based solutions into their own services. For example, a stablecoin payment system or microcredit application launched on Vaulta could be compatible with traditional financial institutions. This would enable Vaulta to bring the concept of Web3 banking to life, providing transparency, speed, and accessibility in financial services.Institutional SupportOne of the most significant steps that strengthened Vaulta's vision was the strategic partnership with World Liberty Financial (WLFI). Aiming to develop decentralized financial services in the US, WLFI decided to integrate its stablecoin, USD1, into Vaulta's banking tools. This will allow users within the Vaulta ecosystem to trade USD1 directly. As part of the partnership, Vaulta's local assets were also included in WLFI's "Macro Strategy" reserve. This reserve is a strategic token pool created to provide long-term support to leading crypto projects like Bitcoin and Ethereum that are transforming global finance. This move strengthened Vaulta not only technically but also in terms of liquidity and institutional trust.Who is Vaulta's Founder?Who owns the Vaulta coin? While this question is frequently asked, Vaulta does not have a single founder or owner. The project is governed by a decentralized governance model. The Vaulta Foundation, a nonprofit organization, and 21 community-elected block producers are jointly responsible for the network's governance. This means that the network's decision-making is not controlled by a single person or company, but rather relies on collaboration between the Foundation and the validators elected by token holders.The Vaulta Foundation is led by Yves La Rose, who has led the community-driven rebirth of the EOS project. Yves La Rose, former CEO of the EOS Network Foundation, played a key role in developing the Vaulta vision. The Foundation determines the network's strategic direction by working with advisory boards comprised of developers, community members, and financial industry experts. For example, the Vaulta Banking Advisory Council, comprised of banking and digital asset experts, advises Vaulta on bridging the traditional finance and Web3 worlds and ensuring regulatory compliance (the formation of this board was announced during the rebranding process).The team behind the Vaulta project essentially restructured EOS's existing technological infrastructure and the power of its community to bring this new vision to life. The community push, which began with the establishment of the EOS Network Foundation in 2021, culminated in the creation of the Vaulta name in 2025. During this period, the original EOS development and support team underwent a major transformation to adapt the network to broader financial applications. Consequently, Vaulta is not a project created from scratch, but rather an evolution of EOS with a new identity.Frequently Asked Questions (FAQ)As you read about Vaulta, you may have new questions. Questions like, "What exactly is the difference between it and EOS?", "What does a token do?", or "How does it connect to Bitcoin?" are among the most frequently asked questions in the community. In this section, you can find frequently asked questions and clear, concise answers to help you better understand Vaulta.What is Vaulta and how is it related to EOS?: Vaulta is the rebranded version of the EOS blockchain in 2025. So, the Vaulta network is technically the successor to EOS and continues on its path with a new name and vision. In short, is Vaulta the old EOS? Yes – built on the EOS community and technology, Vaulta is a new version where EOS tokens are converted to A tokens and the project focuses on Web3 banking.What is the Vaulta network used for?: The Vaulta network is used to provide banking and financial services on the blockchain. Its use cases include payment transfers, savings and loan applications, decentralized finance (DeFi) protocols, digital insurance products, and the tokenization of real-world assets. The goal is to make traditional banking transactions faster, more transparent, and more accessible with Web3 technology.What is the A token used for?: The A token is the native cryptocurrency of the Vaulta network and is central to all transactions on the network. To use the Vaulta network, users stake A tokens to reserve resources such as CPU, NET, and RAM; this eliminates the need for separate gas fees when making transactions on the network. Additionally, the A token grants its holders voting rights in governance (e.g., voting for block producers), and thanks to the exSat integration, users who stake their A tokens have the opportunity to earn Bitcoin returns.What is Vaulta EVM and what does it offer developers?: Vaulta EVM is a smart contract environment compatible with the Ethereum Virtual Machine running on the Vaulta network. This allows developers to run Ethereum smart contracts they write with Solidity directly on Vaulta. Vaulta EVM integrates with Ethereum tools (e.g., the Solidity compiler and MetaMask wallet) and offers faster finality (1 second) and lower transaction costs compared to Ethereum, providing developers with ease and speed. How does Vaulta integrate with the Bitcoin network?: Vaulta connects to the Bitcoin network via the exSat protocol and bridge integrations. exSat is a private sidechain that transfers Bitcoin's on-chain UTXO data to Vaulta, making Bitcoin available within the Vaulta ecosystem. This makes it possible to write Bitcoin-powered smart contracts on Vaulta, use BTC in DeFi applications, or earn returns on Bitcoin. Furthermore, this integration is done directly with actual Bitcoin assets, eliminating the need for wrapped BTC (like WBTC), which is typically required.Is Vaulta centralized or decentralized?: The Vaulta network operates with DPoS (Delegated Proof of Stake), a decentralized consensus system. In theory, it is decentralized, with 21 block producers elected by token holders managing the network. However, there are criticisms that in practice, it is not truly decentralized due to the limited number of block producers and the Foundation-led development. However, Vaulta is not owned by a single company but is community-driven, with decisions made collectively through on-chain governance mechanisms.For more content on Vaulta and Web3 banking solutions, follow our JR Crypto Guide series.
ARB Comment and Price Analysis - August 12, 2025 | JrKripto
ARB Technical OutlookA very wide and regular falling wedge formation is striking on the ARB weekly chart. The formation's inception dates back too far to be visible even on the daily chart, clearly demonstrating the long-term nature of the structure.In the current outlook, the price is trading at $0.4371. Although a recent attack above $0.4515 failed to sustain itself and retreated back to horizontal support. This area is critical for determining short-term direction.Horizontal levels of $0.4515 and $0.5046 act as short-term resistance. Daily closes above $0.5046, in particular, could clarify the falling wedge breakout. In this scenario, the technical formation target of $2.4250 would resurface in the medium to long term.On downward movements, support levels of $0.3558, $0.3453, and the channel lower band of $0.2849 should be monitored. Wedge Formation Falling on a Weekly Basis Summary:Price: $0.4371, close to horizontal resistance levels within a wedge formationFormation: Long-term falling wedgeTarget in case of an upward breakout: $2.4250Short-term resistance levels: $0.4515 → $0.5046 → $0.5475Support levels: $0.3558 → $0.3453 → $0.2849This analysis does not constitute investment advice and focuses solely on support and resistance levels that may present potential short- to medium-term trading opportunities based on market conditions. All trading and risk management decisions are solely the responsibility of the user, and the use of stop-loss is strongly recommended.
Stablecoin Giant Circle Unveils Its Own Blockchain: Here's the Launch Date
Circle, the US-based publicly traded company behind USDC (USD Coin), the world's second-largest stablecoin by market capitalization, is preparing to launch its own Ethereum Virtual Machine (EVM)-compatible Layer-1 blockchain. The company shared details of this new network, dubbed "Arc," on Tuesday, as it announced its second-quarter (Q2) 2025 financial results.Arc aims to provide an "enterprise-grade foundation" specifically for stablecoin payments, foreign exchange (FX) transactions, and capital markets applications. According to Circle, Arc is being developed entirely as a USDC-focused infrastructure, with USDC as the network's native gas token. This will allow users to pay transaction fees directly on the network with the stablecoin.Arc's public testnet launch is planned for this fall. The network will offer an integrated stablecoin exchange engine, sub-second settlement, and optional privacy features. Circle emphasized that Arc will be fully integrated with the company's existing platforms and services, as well as compatible with the 24 different partner blockchains it supports.Circle Announces Net LossAccording to Circle's financial data, the company's total revenue and reserves increased by 53% year-over-year, reaching $658 million. Other revenue lines saw a remarkable 252% increase, largely driven by growth in subscription, service, and transaction revenue.USDC supply also gained significant momentum during this period. The supply, which had increased by 90% year-over-year to $61.3 billion, increased by another 6.4% to $65.2 billion as of August 10th. USDC's total market capitalization currently stands at approximately $65.6 billion, with the largest supply ($42.6 billion) held by the Ethereum network.Despite this, the company reported a net loss of $482 million due to non-cash expenses of $591 million related to the IPO. Of these expenses, $424 million was from stock-based payments and $167 million from fair value increases on convertible debt. Adjusted EBITDA increased by 52% to $126 million.“The future of stablecoin finance”Circle CEO and Co-founder Jeremy Allaire stated that the second quarter was a critical period for the company as the first quarter after its IPO. “It’s exciting to see the growing adoption of our platform across different sectors and globally.” Allaire also emphasized that the $1.2 billion IPO, which closed in June, was a turning point in the adoption of stablecoins.The company also highlighted the GENIUS Act, signed by President Trump last month, which established a federal regulatory framework for payment stablecoins. Circle stated that this legislation legally establishes the compliance standards it has long championed and strengthens its position as a regulated stablecoin issuer. Following these developments, Circle shares rose 6.2% in premarket trading Tuesday.
TON Comment and Price Analysis - August 12, 2025 | JrKripto
TON Current Technical OutlookOn the broader timeframe, TON continues to maintain its ascending channel structure. The lower channel support has remained strong, as noted in the previous analysis. Notably, during the sharp pullback at the end of June, the price once again found support at this trendline and reacted upwards. TONE Wide Angle View Following this reaction, the price has managed to hold above the $2.76 level. This zone remains significant as both the lower channel boundary and a key horizontal support. In the current outlook, the price has broken above the $3.31 resistance and is attempting to sustain above it. Historically, this level has been tested multiple times and has acted as a strong resistance with notable selling pressure. Sustained price action above this area could signal a clearer shift towards an upward trend.If the movement within the channel continues, the next short-term target will be the $3.50 resistance. A break above this level could open the way towards:$4.13 (major horizontal resistance)$4.87 – $5.16 (medium-term target zone)Channel upper boundary at $6.00+In the event of a pullback:First support: $3.10 – $2.76 rangeBelow this area, $2.18 should be monitored as a critical support.These analyses, which do not constitute investment advice, focus on support and resistance levels that may present short- to medium-term trading opportunities under current market conditions. However, all trading and risk management decisions remain the sole responsibility of the user. The use of stop-loss orders is strongly recommended for any positions taken based on this analysis.