Altcoin
This page lists the latest Altcoin news and market analysis. Browse articles, expert insights, and updates in this category on JrKripto. Stay informed with in-depth coverage of cryptocurrency trends and developments.
News
Altcoin News
Altcoin News
Browse all Altcoin related articles and news. The latest news, analysis, and insights on Altcoin.
WLD Comment and Price Analysis - September 1, 2025
WLD/USDT Technical AnalysisThe WLD chart shows a descending triangle pattern. The price is moving in a tight range with lower highs and higher lows. These patterns usually end with a strong breakout.The current price is $0.88, trading close to the lower band of the triangle. The $0.85 level is a key support. If this level holds, the pattern stays valid. If it breaks, the next supports are at $0.81, $0.71, and $0.64.On the upside, the first resistance is at $0.97 – $1.00. The main decision zone is $1.10 – $1.15, which overlaps with the triangle’s upper band. A breakout above this level, with strong volume, could confirm the bullish scenario and target $1.28 – $1.35, and later $1.60. Narrowing Triangle Structure SummaryThe triangle pattern is active and close to its final stage.$0.85 is the critical support. Below that: $0.81 → $0.71 → $0.64.First resistance: $0.97 – $1.00. Main decision zone: $1.10 – $1.15.Break above the upper band could lead to $1.28 – $1.35 and then $1.60.These analyses, not offering any kind of investment advice, focus on support and resistance levels considered to offer trading opportunities in the short and medium term according to the market conditions. However, traders are responsible for their own actions and risk management. Moreover, it is highly recommended to use stop loss (SL) during trades.

ZRO Comment and Price Analysis - September 1, 2025
ZRO Technical OutlookZRO is still trading inside a wide horizontal channel. ZRO is currently at $1.87, touching the lower border of a triangle-like consolidation pattern. Holding this area is critical to keep the structure positive.In the short term, staying above $1.87 could trigger another upward move. The first resistance is at $2.08. If this level breaks, the next targets are in the $2.58 – $2.76 range. The upper border of the channel at $3.35 stands as the major resistance. A breakout above this level would confirm a larger bullish structure.On the downside, if the price falls below $1.87, the first key support is $1.65. A close under this level could open the way for deeper pullbacks toward $1.46 and $1.33. Range Area SummaryPrice is holding above the critical $1.87 support.First resistance: $2.08.Next resistances: $2.58 – $2.76.Major resistance: $3.35 (breakout could spark strong upside).Supports to watch: $1.87, $1.65, $1.46, $1.33.These analyses, not offering any kind of investment advice, focus on support and resistance levels considered to offer trading opportunities in the short and medium term according to the market conditions. However, traders are responsible for their own actions and risk management. Moreover, it is highly recommended to use stop loss (SL) during trades.

What is Stacks (STX)?
In the cryptocurrency world, Bitcoin is often referred to as "digital gold" and is often known only as a store of value or payment method. However, thanks to additional layers built on Bitcoin, the limits of this powerful network can be pushed much further. This is where Stacks comes in. Stacks (STX) is a protocol that enables the development of smart contracts and decentralized applications (dApps) based on the security of the Bitcoin network. Initially announced as Blockstack, the project was renamed Stacks by community decision in 2020 and has since aimed to bring the Web3 vision to Bitcoin. The STX token is at the heart of the network, offering a wide range of uses, from paying transaction fees to participating in governance, earning Bitcoin rewards through stacking, and developing applications. In short, Stacks serves as a bridge developed to transform Bitcoin's robustness into a modern software ecosystem.This guide covers everything you need to know about Stacks, from its history and technical features to its founders and their role in the ecosystem. Definition and Origins of StacksStacks is a blockchain protocol that leverages Bitcoin's security to enable next-generation applications. While Bitcoin is a unique network in terms of security, its limitations in smart contracts have paved the way for projects like Stacks. Stacks aims to address this shortcoming and make Bitcoin a more programmable platform. This allows both decentralized finance (DeFi) solutions and Web3 applications to be ported directly to Bitcoin. Stacks/Bitcoin integration. Source: Stacks The project first emerged in 2013 under the name Blockstack. The Blockstack team's vision was to build an internet where users controlled their own data, eliminating the need for centralized structures. At the time, blockchain technology was still in its early stages, and even Ethereum was just beginning to gain traction. Therefore, Blockstack was born as an academic initiative and progressed in a research laboratory manner. Presentations and published articles supported by institutions like Princeton University provided the project with a scientific basis.Blockstack made waves with its first whitepaper published in 2017. This document detailed how a software layer built on Bitcoin could function. Around the same time, Blockstack developed the decentralized storage solution Gaia and the identity system, which allowed users to store their identities on the blockchain. These products proved that the project worked not only in theory but also in practice. The community began to grow rapidly during this period, and Blockstack events began to be organized.2019 was a historic year for Blockstack. The team became the first blockchain startup to hold a public token sale, receiving approval from the U.S. Securities and Exchange Commission (SEC). This sale launched the STX token and attracted investor interest. While regulatory uncertainty was a topic of discussion in the crypto world at the time, Blockstack's compliance with the legal framework generated significant buzz. This step both added credibility to the project and signaled that Stacks would become an attractive infrastructure for institutional investors in the future.In 2020, the project underwent a significant transformation. Following a community vote, Blockstack's name was changed to "Stacks." Blockstack originated from the idea of a decentralized internet; Stacks, however, focused directly on Bitcoin and evolved into a powerful platform for smart contracts and dApps. During this period, Blockstack PBC, renamed Hiro Systems PBC, continued to provide developers with tools and infrastructure.Preparations for Stacks 2.0 began around the same time. With this update, which went live in early 2021, the Proof of Transfer (PoX) consensus mechanism was introduced, and smart contracts became writeable using the Clarity programming language. Stacks 2.0 further deepened its integration with Bitcoin and offered STX holders the opportunity to earn Bitcoin rewards by locking their tokens. This was the birth of the mechanism known as "stacking." Thus, Stacks emerged as a unique ecosystem operating with Bitcoin's security, offering programmable rewards, and offering rewards.In short, the journey that began as Blockstack continues today as Stacks. Initially conceived with the vision of a decentralized internet, the project has evolved into a protocol that builds smart contracts on Bitcoin. Born as a research idea in 2013, Blockstack has achieved a unique position in the crypto world with critical milestones such as the SEC-approved token sale and Stacks 2.0. Today, Stacks is one of the strongest bridges on the path to the Web3 vision by making Bitcoin programmable.Stacks' History: Key MilestonesStacks' development process isn't just a name change; it's a major evolutionary story in the blockchain world. What began as a small research project in 2013 has grown over the years, both technically and in terms of community support, transforming it into one of the most important layers of the Bitcoin ecosystem. Below, we'll examine the critical milestones in Stacks' history in chronological order.2013: The Blockstack project was launched by Muneeb Ali and software developer Ryan Shea from Princeton University. The initial goal was to create an internet infrastructure where users could control their data and not be reliant on centralized structures.2017: The project's first whitepaper was published. This step laid out how the Blockstack vision would technically function. Community support grew significantly during this period, and Blockstack began to gain recognition not only in academic circles but also within the crypto community. 2019: Blockstack PBC (now Hiro PBC) made history by holding the first SEC-approved public token sale. This sale, conducted under Reg A+ regulation, officially launched the STX token. This made Blockstack one of the leading projects in the crypto world that operates in compliance with regulations.2020: Following a community vote, the project was rebranded, and the Blockstack name was changed to "Stacks." This change signified not only a name update but also a vision update. The project now became a protocol focused on building smart contracts on Bitcoin.2021: On January 14, 2021, the Stacks 2.0 mainnet was officially launched. This update introduced the Proof of Transfer (PoX) consensus mechanism, introduced the Clarity programming language for developers, and allowed STX holders to earn Bitcoin rewards for staking their tokens. These developments transformed Stacks from a mere vision project into an active ecosystem. 2023–2024: The Ordinals protocol and the NFT wave attracted significant attention in the Bitcoin ecosystem. This period also served as a jumping-off point for Stacks. Bitcoin DeFi applications began to develop on Stacks, particularly with solutions like sBTC, which backs 1:1 Bitcoin, and the ecosystem grew significantly.2025: The Stacks ecosystem experienced a major leap forward. TVL exceeded $100 million, sBTC and STX were migrated to networks like Sui via Wormhole, and developer activity reached a record high. Furthermore, preparations for the Nakamoto upgrade accelerated, the STX Endowment fund was launched, and institutional expansions took place in the Middle East and Asia. As of September 2025, the STX price was around $0.60. Why Is Stacks Valuable?Stacks is a pioneering protocol that enables smart contracts on Bitcoin. Its most important feature is its robust security and direct use of Bitcoin's vast ecosystem. All transactions on Stacks are confirmed by being embedded in Bitcoin blocks. This means that an attacker attempting to manipulate the Stacks network would also need to rewrite the Bitcoin chain, which is virtually impossible.Stacks' security model is based on a unique mechanism called Proof of Transfer (PoX). In this system, miners spend Bitcoin to produce Stacks blocks. A portion of this spent BTC is shared with users who contribute to the network, or "stackers," who lock their STX tokens. This allows both new blocks to be created and Bitcoin rewards to be distributed to those participating in the ecosystem. In other words, STX holders can "stack" their tokens by locking them for a certain period of time and earn BTC directly in return. This feature makes Stacks not only a smart contract platform but also an ecosystem that offers passive income opportunities to its users. Stacks' mechanism. Source: Stacks Additionally, Stacks is building a rich Web3 world on Bitcoin. Numerous projects, including wallet applications, NFT platforms, decentralized exchanges (DEXs), and lending and borrowing protocols, run on the Stacks network. Developers can write secure and predictable smart contracts that can read Bitcoin's on-chain state using the specially designed Clarity programming language. One of Stacks' key differentiators is its ability to pave the way for Bitcoin DeFi solutions.Technical FeaturesThe most striking element of Stacks's technical structure is its Proof of Transfer (PoX) consensus mechanism. In this system, Stacks miners generate blocks by spending Bitcoin, and a portion of the spent BTC is distributed to users (stackers) who lock their STX tokens. Thus, the Stacks network directly leverages Bitcoin's security, and each block is embedded in the Bitcoin chain, providing an additional layer of security.The network's native token is STX. The total supply is planned to reach approximately 1.818 billion units over time, and this emission process will continue until 2050. The minting of new STX tokens and their reward mechanisms are managed through the PoX system. This allows the supply to expand transparently, based on specific rules.Stacks blocks operate in sync with Bitcoin blocks. The average block time is approximately 10 minutes because it directly parallels Bitcoin's block time. However, the planned Nakamoto upgrade aims to reduce this time to seconds, making the network significantly faster.For smart contracts, Stacks uses the specially designed Clarity programming language. Clarity is a decidable language, providing a secure and predictable structure because its outcome is known before execution. Furthermore, thanks to its ability to read the state of the Bitcoin chain, developers can write dApps and smart contracts that interact directly with Bitcoin assets. Clarity language example. One of the standout features for STX holders is the stacking mechanism. Users can contribute to the network by locking their STX tokens for a certain period of time and earn Bitcoin rewards in return. This method, also known as "stacks staking," allows STX holders to both contribute to network security and earn passive income in BTC.Furthermore, the STX token is used to pay transaction fees on the network. It also allows holders to participate in network governance and vote on new proposals. Numerous applications within the Stacks ecosystem, from NFT projects and DeFi protocols to DAO initiatives and decentralized exchanges, operate on the STX token. Thus, Stacks supports a large and vibrant Web3 ecosystem built on Bitcoin.Who Founded Stacks?The founders of Stacks are Muneeb Ali, a computer science PhD student at Princeton University, and software developer Ryan Shea. Ali, who recognized the potential of blockchain technology during his academic studies, focused on building new solutions on Bitcoin. Shea contributed his software development experience to the project.The duo launched a venture called Blockstack in 2013. Initially driven by the vision of building a decentralized internet infrastructure, the team grew the project over the years. In 2020, the name Blockstack was changed to Stacks by community decision.Today, Stacks' development is driven by a global community rather than a centralized team. This is spearheaded by a company formerly known as Blockstack PBC, which later became Hiro Systems PBC. Hiro provides developers with tools that simplify application development on Stacks and supports the growth of the ecosystem. Thus, Stacks has become a constantly evolving platform, driven by both the founders' vision and the contributions of the open-source community.Frequently Asked Questions (FAQ)There are many questions about Stacks. From the project's origins and founders to how it works and the STX token offering, many details remain a source of concern for investors and users. We've prepared answers to frequently asked questions below:When did Stacks (STX) come into being?: The foundations of Stacks were originally laid in 2013 under the name Blockstack, but the project's active entry into the crypto market began in 2018. The project entered a completely new era when the Stacks 2.0 mainnet went live on January 14, 2021. Since then, Stacks has become a powerful infrastructure enabling the execution of smart contracts and real-time applications on Bitcoin.Who are the founders of Stacks?: The founders of Stacks are Muneeb Ali, a PhD candidate in computer science at Princeton University, and software developer Ryan Shea. The duo launched the project in 2013 under the name Blockstack and, over time, brought their vision for Stacks, focused on Bitcoin, to life. Today, development is led by Hiro Systems PBC and a large open-source community, allowing Stacks to continue to exist as a constantly evolving and growing ecosystem. How does Stacks work, and how does it relate to Bitcoin?: While Stacks operates as an independent chain, it has a unique structure that derives its security directly from Bitcoin. Thanks to the Proof of Transfer (PoX) consensus mechanism, miners create Stacks blocks by sending Bitcoin. A portion of spent BTC is distributed to users who lock their STX tokens, ensuring both security and rewarding participants. Ultimately, every transaction made on Stacks is recorded in Bitcoin blocks, ensuring back-to-back verification.What is the total supply of STX tokens?: The total supply of STX tokens is capped at approximately 1.818 billion units. According to the emission plan, this supply will be gradually reached by 2050, and new tokens will continue to be minted through the PoX mechanism. Therefore, the amount of STX in circulation will increase in a controlled and predictable manner over the years.What is Stacks for, and why are they valuable?: Stacks is a leading protocol that enables the development of smart contracts and decentralized applications on Bitcoin. The project distinguishes itself by leveraging Bitcoin's robust security and offering a unique structure with the PoX mechanism. Furthermore, STX holders can lock their tokens for stacking and earn Bitcoin rewards in return. This has made Stacks a sought-after infrastructure for Web3 projects, NFT platforms, and Bitcoin DeFi applications.How can dApps be developed on Bitcoin with Stacks?: Stacks offers developers the specially designed Clarity programming language. Clarity allows developers to read the state of the Bitcoin chain, enabling the writing of secure, predictable smart contracts. As applications run on the Stacks chain, their results are reflected in the Bitcoin network, creating a secure bridge between the two chains. With tools and wallets like Hiro and Xverse, dApp development is becoming more accessible for developers.For more content on Stacks and Bitcoin-based smart contract projects, follow the JR Kripto Guide series.

Coinbase Lists, Chainlink and DWF Support: WLFI Sets Opening Price
Crypto markets were abuzz with activity on September 1st with the launch of the World Liberty Financial (WLFI) token. Following the launch, both exchange announcements and market data indicated a turbulent entry into the market for WLFI.Negative Wave in Funding RatesThe most striking development of the day was the sharply negative values observed in the funding rates for WLFI perpetual contracts. The 4-hour rate on Binance fell to -0.2317%, reaching -1.39% on a daily basis. Similarly, Bybit reached -0.4338%. This chart indicates that many investors are heavily shorting WLFI.Large investments and on-chain movements attracted attention.According to Arkham data, WLFI's official account purchased 6.49 million WLFI in just one hour, spending a total of $2 million. This move demonstrates the team's strong support for the market. Meanwhile, according to LookIntoChain's findings, three major pre-sale participants deposited a total of 160 million WLFI to Binance. The value of these addresses is in the millions of dollars, indicating selling pressure.Exchange announcements: Coinbase, Binance, and DWF Labs investmentWLFI's rapid listings also set the market agenda. Coinbase announced that it will gradually open WLFI-USD trading pairs if sufficient liquidity is provided. On Binance's side, WLFI futures are being converted from pre-trading to standard trading overnight. These contracts will be traded with up to 50x leverage. DWF Labs also announced that it will list WLFI on the DWF Liquid Markets platform, aimed at institutional clients. Chainlink bridge activatedThe WLFI team announced the activation of the Chainlink CCIP bridge, allowing users to transfer the token between the Ethereum, Solana, and BSC networks. Approximately 1.5 hours after the launch, Ethereum network congestion decreased, with gas fees dropping to 32.4 Gwei. This development indicated that the high trading volume experienced during the launch quickly returned to normal.Price Performance and the Trump Family's MessageWLFI opened for trading at $0.478 on Binance but quickly fell to $0.3. This decline, combined with intense short positions and selling pressure, raised questions among investors. Eric Trump's social media post added a political dimension to the launch. Trump announced the launch with the words, "We are now live," and stated that the WLFI would be "a standard of financial freedom that represents US leadership."
BTC Weakens in Crypto Investment Products: ETH, SOL, XRP, ADA, LINK and CRO Lead
Crypto investment products performed strongly in August, accelerating the inflow of fresh capital into the market. According to CoinShares' latest report, net inflows of $2.48 billion were recorded last week alone. This brings the August total to $4.37 billion, while inflows since the beginning of the year have reached $35.5 billion. However, due to the negative market price movement, total assets under management (AUM) declined by 10% to $219.8 billion.The Shadow of Macro DataFund inflows, which had been positive throughout the week, turned negative following Friday's release of US core PCE data. The underperforming data weakened the prospects for a September interest rate cut, limiting demand for digital assets. CoinShares Head of Research James Butterfill stated that this development was disappointing for investors.Regional Outlook: US Remains LeadingRegionally, the US market remains the leader with weekly inflows of $2.29 billion. $4.35 billion flowed into US funds throughout August. Switzerland, with $109.4 million, Canada, and Germany, with $41.1 million in inflows, were other prominent countries. Sweden, however, saw a notable weekly outflow of $45.2 million, bringing the total outflow to $253.2 million in August. This figure demonstrates the diversification of investor behavior across European countries.iShares Leads the Way Among Fund ProvidersiShares/USA was clearly the leading provider among investors' preferred providers. With $1.21 billion in inflows in just one week, iShares funds recorded net inflows of $4.09 billion for the entire August, maintaining their leadership position with a record $30.6 billion in inflows since the beginning of the year. ProShares and 21Shares, with $183 million and $102 million, respectively, were also prominent providers. In contrast, Fidelity (-$662 million), ARK 21Shares (-$621 million), and CoinShares XBT Provider (-$254 million) experienced significant outflows in August.Ethereum funds outperform BitcoinThe largest difference in terms of assets was seen on Ethereum. Ethereum funds recorded $1.42 billion in inflows last week, reaching a total of $3.96 billion in August. Bitcoin funds, on the other hand, experienced $301 million in outflows for the month, despite a weekly inflow of $748 million. Year-to-date, Bitcoin funds have seen total inflows of $20.8 billion, while Ethereum's has risen to $12 billion.Solana funds attracted attention with a weekly inflow of $177 million, while XRP funds gained $134 million. The movement in these two altcoins is linked to expectations for potential spot ETF approval in the US. Cardano ($10.4 million), Chainlink ($7.7 million), and Cronos ($4.5 million) also saw positive inflows, albeit limited, in August. In contrast, Sui recorded an outflow of $10.4 million. August was a strong month for crypto investment funds. Ethereum, in particular, has become a clear favorite among institutional investors, while Bitcoin's outflows signal a market shift. Increasing demand for altcoin funds like Solana and XRP suggests investors are diversifying. Regional differences, macroeconomic data, and Fed policies will be the most important factors shaping fund movements in the coming period.
Bitcoin and Altcoins Await Inflation and Employment Data
The cryptocurrency market experienced sharp fluctuations over the weekend. Leading cryptocurrency Bitcoin (BTC) opened the week at $107,383, while Ethereum (ETH) fell to $4,385. Bitcoin then rose to $109,500, and Ethereum, from the bottom, rose to $4,460. So, what was behind the decline? Recent macroeconomic data, particularly from the US, dampened investors' risk appetite and increased selling pressure in the market.PCE data shook the crypto marketLast Friday's Personal Consumption Expenditures (PCE) inflation data was the main factor determining market direction. According to the data, core inflation rose by 2.9% year-on-year in July. This figure, which was in line with expectations, was the highest rate seen since February. The persistence of high inflation overshadowed expectations for an interest rate cut expected in September. Presto Research analyst Min Jung said, “A sell-off in the crypto market has intensified following the PCE data. Investors are pricing in the possibility of the Fed postponing its interest rate cut.”Whales are sellingIn addition to the pressure created by the macro data, large-scale Bitcoin wallet sell-offs have also pushed prices down. Kronos Research CIO Vincent Liu noted that recent whale sell-offs have led to the liquidation of leveraged positions, saying, “The $100,000 level stands out as critical psychological support for Bitcoin. If this level is broken, a broader liquidity squeeze could occur in the market.”Liu also emphasized that $4,000 is a critical threshold for Ethereum. He warned that if it falls below these levels, the crypto market could face a much sharper correction.Altcoins also under pressureNot only Bitcoin and Ethereum, but also leading altcoins, have lost value. XRP fell 3.67% to $2.73, while Solana (SOL) retreated 2.71% to $198.6. The broader market was in the red as investors averted risk. However, at the time of writing, a partial recovery was underway. Current prices:XRP (XRP): $2.79BNB (BNB): $865.17Solana (SOL): $202.78Dogecoin (DOGE): $0.216TRON (TRX): $0.341However, the last 7-day performance remains negative: XRP is down 4.79%, and ETH is down 2.77%. All Eyes on Nonfarm Payrolls and the FedInvestors are now on the radar for this week's Nonfarm Payrolls (NFP) data. A strong labor market performance could support the Fed's tight stance and create further selling pressure in the crypto market. Weak data could boost demand for riskier assets, triggering a recovery in Bitcoin and Ethereum.The Fed's highly anticipated interest rate decision will be announced at the FOMC meeting on September 16-17. According to CME FedWatch Tool data, markets still expect a 25 basis point rate cut with an 87.6% probability. However, high inflation could lead to a reshaping of these expectations in the coming days.The cryptocurrency market is on edge due to both macro data and on-chain movements. Whether Bitcoin can maintain its $100,000 support level and Ethereum's $4,000 support level will determine short-term direction. The next two weeks are crucial for market participants due to both employment data and the Fed meeting.
Binance and 2 Exchanges List Trump-Linked WLFI Token Today
The cryptocurrency market got off to a busy start this week. Binance, the world's largest exchange, announced that it has become the first cryptocurrency exchange to list the World Liberty Financial (WLFI) token, which is linked to the Trump family. This announcement is crucial as WLFI transitions from its "non-transferable" design during the presale period to its full trading status, as Binance is the largest cryptocurrency exchange by daily trading volume.Binance announced that it will launch spot trading for WLFI in USDT and USDC pairs at 4:00 PM Turkey time. Deposits are already active, and withdrawals will open on Tuesday. The exchange also announced that it will apply a "seed tag" to WLFI. This tag is typically used for innovative but high-risk tokens. Users must pass short tests confirming their acceptance of additional risk warnings to access WLFI transactions.The project's WLFI tokens were designed to be non-transferable during the presale period. This was done to prevent the tokens from freely changing hands for compliance reasons. However, with the Binance listing, the token will now be freely tradable.News of listings came from both South Korean exchangesFollowing Binance's announcement, Upbit, one of South Korea's largest exchanges, also announced that it would list WLFI. It is also reported that Bithumb is preparing to follow suit.Market data shows significant investor interestWLFI had begun trading in derivatives markets before being offered for spot trading on Binance. Last week, WLFI futures were launched on the Hyperliquid decentralized exchange, and investors quickly took short positions. This reduced the token's valuation from $44 billion to $24 billion in a matter of hours.Despite this, interest remains high. According to Coinglass data, more than $3.1 billion in WLFI derivatives trading volume occurred in the last 24 hours alone. Open interest increased by over 50 percent to $760 million. Binance solidified its leadership by single-handedly accounting for more than half of this volume. Twenty percent of the token supply, the first portion of tokens purchased by early investors at $0.015 and $0.05, will be unlocked today through a mechanism called "Lockbox." This corresponds to approximately 5% of the total supply. At current prices, early investors have the potential to achieve approximately 20x returns.Will it break into the top 10 crypto projects?With a total supply of 100 billion units and current price levels, WLFI could reach a fully diluted market capitalization (FV) of over $31 billion. This would place the project in the same league as established projects like Dogecoin, Tron, and Sui. The 22.5 billion WLFI tokens held by DT Marks DEFI LLC, a company affiliated with the Trump family, are worth over $7 billion at current prices. However, these tokens, like the shares of team members and advisors, will not be released immediately. Political debatesThe project's connection to the Trump family is generating controversy in US politics. Democratic Party members argue that former President Trump's involvement in the project could pose a corruption risk. While some measures to limit conflicts of interest were discussed under the GENIUS Act, which became law in July, they were not fully incorporated into the bill.
ADA Comment and Price Analysis - August 31, 2025
ADA Technical AnalysisWith the upward breakout of the falling wedge on the ADA chart, the market structure continues positively. We see that it retraces after the breakout and then moves to the $1 region. We can say that the trend is positive after this point. This structure will be maintained as long as it remains above $0.68.In the short term, the levels to watch out for in case of pullbacks are as follows:$0.87 appears to be the first area where we believe the price could hold on to a pullback.$0.79 is a more suitable and clearer area for a reversal. Any pullbacks up to this level will not disrupt the positive structure.In the continuation of the upward movement, $1.10 and $1.35 will be targets. In particular, breaking the $1 psychological resistance could accelerate the rise. Falling Wedge Fracture These analyses do not constitute investment advice and focus on support and resistance levels that may present potential trading opportunities in the short and medium term, depending on market conditions. However, the responsibility for executing trades and managing risk lies entirely with the user. It is also strongly recommended to use stop-loss orders for any trades mentioned.
SOL Commentary and Price Analysis - August 31, 2025
SOL Technical AnalysisSolana continues to trade within its broad ascending channel structure, which has remained intact for a considerable time. Both the lower and upper boundaries of the channel remain valid in the bigger picture. Recently, the price has been moving upward within the mid-zone of this channel.The $167.87 horizontal support level was tested in recent days, with the price rebounding strongly from this area. This level is critical as it coincides with both horizontal support and the ascending trendline. The price is currently around $183.77 and is advancing toward the upper resistance area.If the price maintains stability above $167, the upward movement is expected to continue. In this scenario, the next targets to watch are $191.89, $201.24, and $233.18, respectively. Technically, the upper boundary of the channel aligns with the $300 level, forming a strong medium-term target.In case of a pullback, the first support will be $167.87. Below this, the $146.86 – $140.03 range will serve as a critical support area. For deeper corrections, the $121.00 – $122.00 zone near the channel’s lower boundary stands out as a strong demand area. Rising Channel Structure Summary:Price: $183.77, trading within an ascending channelFirst support: $167.87Upside targets: $191.89 → $201.24 → $233.18 → $300Primary trend: Ascending channel remains intact; uptrend is preservedThis analysis does not constitute investment advice and focuses solely on support and resistance levels that may present potential short- to medium-term trading opportunities based on market conditions. All trading and risk management decisions are solely the responsibility of the user, and the use of stop-loss orders is strongly recommended.
ZK Comment and Price Analysis - August 30, 2025
ZK/USDT Technical AnalysisWhen we analyze the ZK chart, we see that the long-term downtrend has been broken to the upside. ZK is now trading in the retest zone following this breakout. This retest is very important because it helps confirm whether the trend change is healthy. Falling Trend Breakage After the breakout, the price moved up to the $0.065 – $0.067 range but faced selling pressure there. It is currently trading around $0.061 and trying to stay above the $0.059 support. This level is important since it overlaps with the retest area.In the bullish scenario, if the price breaks above the $0.065 – $0.067 range again, the next resistance levels are at $0.074 and $0.078. If these are cleared, the price could target $0.091 in the medium term.In the bearish scenario, if the $0.059 support is lost, the next key supports are at $0.051 and $0.046. These areas need to hold to keep the breakout structure valid.These analyses, not offering any kind of investment advice, focus on support and resistance levels considered to offer trading opportunities in the short and medium term according to the market conditions. However, the user is responsible for their own actions and risk management. Moreover, it is highly recommended to use stop loss (SL) during trades.

TON Comment and Price Analysis - 30 August 2025
TON Technical AnalysisAnalyzing TON chart on a daily time frame, we can see an ascending channel pattern. The price of the coin has tested both the lower and middle bands of this channel many times. TON is currently trading around $3.06, close to the middle border of the channel.The most important short-term support is the $3.10 – $3.00 zone. If this level breaks, the next support is at $2.76, which also matches the lower trendline of the rising channel. Keeping $2.76 is critical for the uptrend to continue. In a deeper pullback, $2.18 is the stronger bottom support.On the upside, the first resistance is at $3.31. Above that, $3.50 and $4.13 are the next resistance levels. If the price closes above $4.13, it could move towards the $4.87 – $5.16 range in the medium term.Overall, TON is still trading inside the ascending channel and currently testing the mid-band support. Holding above $3.00 keeps the bullish scenario valid. Closing above $3.50 may speed up the uptrend, while closing below $2.76 could weaken it. Rising Channel Structure SummaryTON is moving inside an ascending channel$3.00 – $3.10 is a key support, below it $2.76$3.31 and $3.50 are short-term resistancesAbove $4.13, price may target the $5 areaBelow $2.76, the bullish trend could breakThese analyses, not offering any kind of investment advice, focus on support and resistance levels considered to offer trading opportunities in the short and medium term according to the market conditions. However, the user is responsible for their own actions and risk management. Moreover, it is highly recommended to use stop loss (SL) during trades.

PYTH Comment and Price Analysis - August 29, 2025
PYTH Technical AnalysisThe U.S. Department of Commerce announced a strategic partnership with Pyth Network.Now, critical U.S. economic data will be published on-chain through Pyth.This is one of the first examples where a government-backed data source is integrated with decentralized oracle solutions. This news increased investor interest, and PYTH price entered an important technical breakout period.When we analyze the chart, we see that after the breakout, the price rose sharply to $0.1460, then $0.1680–$0.1765, and later reached $0.2060. This move reached a resistance area not seen for about 2.5 months.The zone $0.1680–$0.1765 has been tested before and is a strong supply area.After reaching it, daily candles show weakness and wicks. Some profit-taking from this zone is likely. If selling continues, the first support is $0.1680, and a strong support zone is $0.1270–$0.1208.This zone includes the broken triangle’s upper band and short-term demand.Even if the price drops here, the overall structure is expected to stay positive.For PYTH to continue rising, it needs to close above $0.1765.If it holds above this level, $0.2060 becomes the next strong resistance.Sustained trading above $0.2060 could signal a medium-term trend change.These analyses, not offering any kind of investment advice, focus on support and resistance levels considered to offer trading opportunities in the short and medium term according to the market conditions. However, the user is responsible for their own actions and risk management. Moreover, it is highly recommended to use stop loss (SL) during trades.

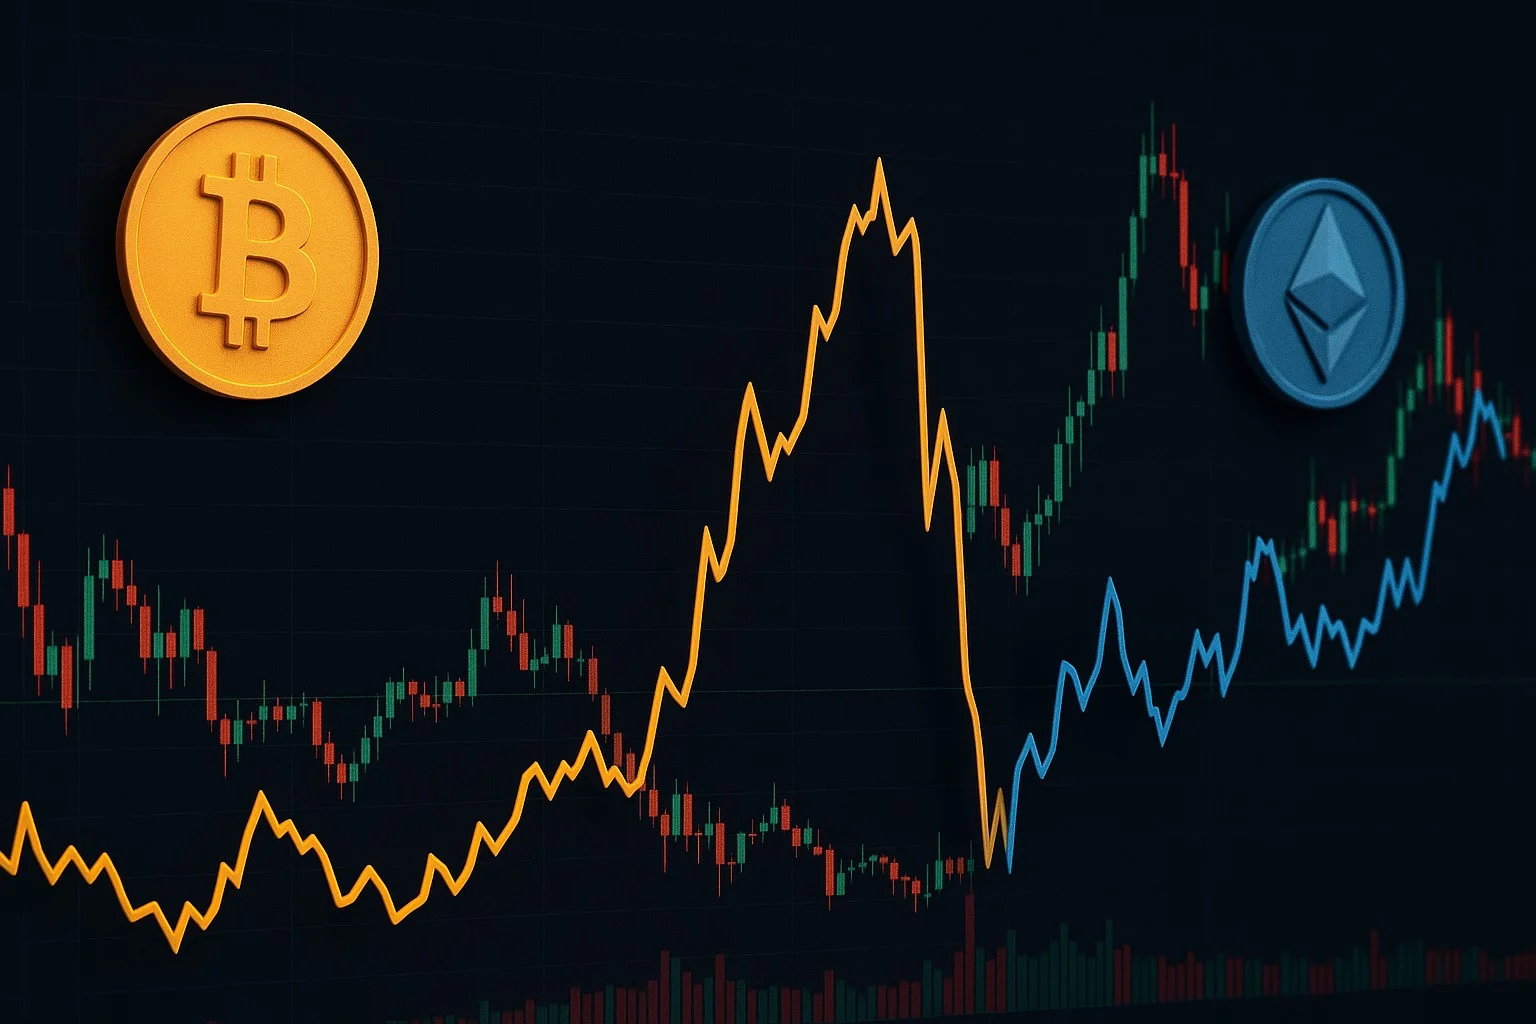
Ethereum ETFs Shine in August: Bitcoin ETFs Reverse
Spot Ethereum ETFs in the US are poised to close August with net inflows exceeding $4 billion. Meanwhile, Bitcoin ETFs are on track to close the month with net outflows this time, following their strong performance in previous months.Ethereum's RiseAccording to market data, spot Ethereum ETFs recorded net inflows of approximately $4 billion in August. This figure was the second-highest monthly performance for Ethereum funds, following the $5.4 billion record set by Ethereum funds in July. This trend, which accelerated since July 17th, paralleled the sharp rise in the price of Ethereum. While ETH had been in a year-to-date loss against BTC until mid-July, it quickly gained a 13.8% return advantage. The chart over the last six weeks is particularly striking: Bitcoin ETFs outperformed Ethereum ETFs for only seven days during this period. In terms of net inflows, Bitcoin funds recorded $505 million in inflows during the same period, while a total of $7.1 billion flowed into Ethereum funds. Headwinds for BitcoinBitcoin ETFs maintained their lead in July with $6 billion inflows. However, things reversed in August. According to current data, $622.5 million in outflows from Bitcoin funds occurred during the month. This marks Ethereum products' largest monthly lead since they began trading in July 2024.A look at the cumulative figures for the last two months reveals that Ethereum ETFs led with $9.5 billion in net inflows. Bitcoin funds recorded $5.4 billion in inflows during the same period. However, from a long-term perspective, it's worth noting that Bitcoin products still hold a clear lead: BTC ETFs topped the list in cumulative inflows at $54.6 billion, while Ethereum products remained at $13.7 billion. This is largely due to the fact that Bitcoin funds launched earlier, with a six-month advantage.The seven-day daily inflow lead for Ethereum ETFs ended on August 28. That day, $178.9 million inflows into Bitcoin ETFs, while $39.1 million inflows into Ethereum funds were particularly notable. Ark Invest's ARKB fund attracted $79.8 million in inflows. BlackRock's IBIT fund received $63.7 million in inflows. On the Ethereum front, BlackRock's ETHA product led the way with $67.6 million.Bitcoin ETFs still lead in trading volume. However, daily volumes for Ethereum funds are gradually approaching. On August 28, ETH ETFs generated $2 billion in volume, while BTC funds reached $2.5 billion.Timothy Misir of BRN Research notes that ETF demand continues to absorb more than twice Bitcoin's daily supply. However, he states that BTC remains stuck around $111,000, suggesting a neutral outlook for the market. On the Ethereum side, a drop below the $4,500 support is considered a sign of short-term weakness.

Crucial Friday for Bitcoin and Ethereum: $14 Billion in Options Expires
Crypto markets are preparing for sharp volatility today. A total of $14.6 billion in Bitcoin and Ethereum options contracts for August are expiring at the end of the day. Because it's the end of the month, today's expiration is significantly higher than in previous weeks.$11.47 Billion in Options on BitcoinAccording to Deribit data, $11.47 billion in options contracts are expiring for Bitcoin alone. There are a total of 102,598 options contracts, and the Put/Call ratio, which reflects the balance between puts and calls, is 0.78. This ratio signals a cautious but generally optimistic outlook in the market. The "maximum pain" level for Bitcoin options today is set at $115,000. This means that most investors will experience the greatest losses when the price approaches this level. Therefore, the expiration of options could push prices towards this critical point. $3.1 billion in Ethereum options contracts are expiring.On the Ethereum side, $3.137 billion in options contracts are expiring. The total number of open interest is 697,419, and call options clearly dominate. The put/call ratio is at 0.77, indicating that investors are more bullish on ETH.The "maximum pain" level for Ethereum is $3,800. This price range could put pressure on ETH upon expiration. Analysts note that Ethereum options offer a weaker outlook compared to Bitcoin, and that upside expectations are limited.Nvidia Effect: Could Markets Experience Extra Volatility?As the option expiration approaches, the main debate in the market is how Nvidia's strong earnings results, announced on Wednesday, will impact cryptocurrencies. According to analysts, the company's massive earnings have triggered volatility in traditional markets, and this impact is likely to spill over into Bitcoin and Ethereum. According to markets data, Nvidia's implied volatility (IV) is at 100%, with a 7% price movement expected. The main question on crypto investors' minds is: "Will Bitcoin move in line with traditional markets due to Nvidia's influence, or is it now sufficiently independent?"Expected Market ScenarioAs of today, Bitcoin is trading at $109,561, while Ethereum is at $4,4300. Consequently, crypto markets are poised for a volatile time today due to both the high volume of options expiration and the Nvidia influence. Investors will be watching closely to see whether Bitcoin will approach $115,000 or enter a stronger uptrend despite the options pressure.
ARKM Comment and Price Analysis - August 28, 2025
ARKM Technical AnalysisArkham Intelligence, which is an AI company supported by OpenAI, announced a new partnership this week in blockchain security. Arkham integrated its on-chain data with the crypto insurance platform InsurAce. This integration could help detect anomalies early and reduce insurance risks. On the chart, ARKM is moving toward the end of a symmetrical triangle pattern. Symmetrical Triangle Structure When we analyze ARKM on a daily time frame, we see that the recent price action between $0.5544 – $0.5023 shows that the triangle is almost complete. The apex of the triangle matches the first days of September, meaning the next few daily candles will be very important.If the price makes a clear breakout above $0.5544, buyers will take control. But if $0.4850 breaks down, we may see a sharp move to the downside.ARKM is currently trading around $0.5140, sitting in the middle of the triangle. The zone $0.5023 – $0.4850 acts as both horizontal support and the lower border of the triangle.On the upside, the levels $0.5544 – $0.570 are both the triangle’s upper border and a strong resistance area from the past. If the price moves above this zone, the next targets are $0.6119 and $0.6337. However, until the triangle breaks upward, these targets are still early to expect.These analyses, not offering any kind of investment advice, focus on support and resistance levels considered to offer trading opportunities in the short and medium term according to the market conditions. However, the user is responsible for their own actions and risk management. Moreover, it is highly recommended to use stop loss (SL) during trades.