
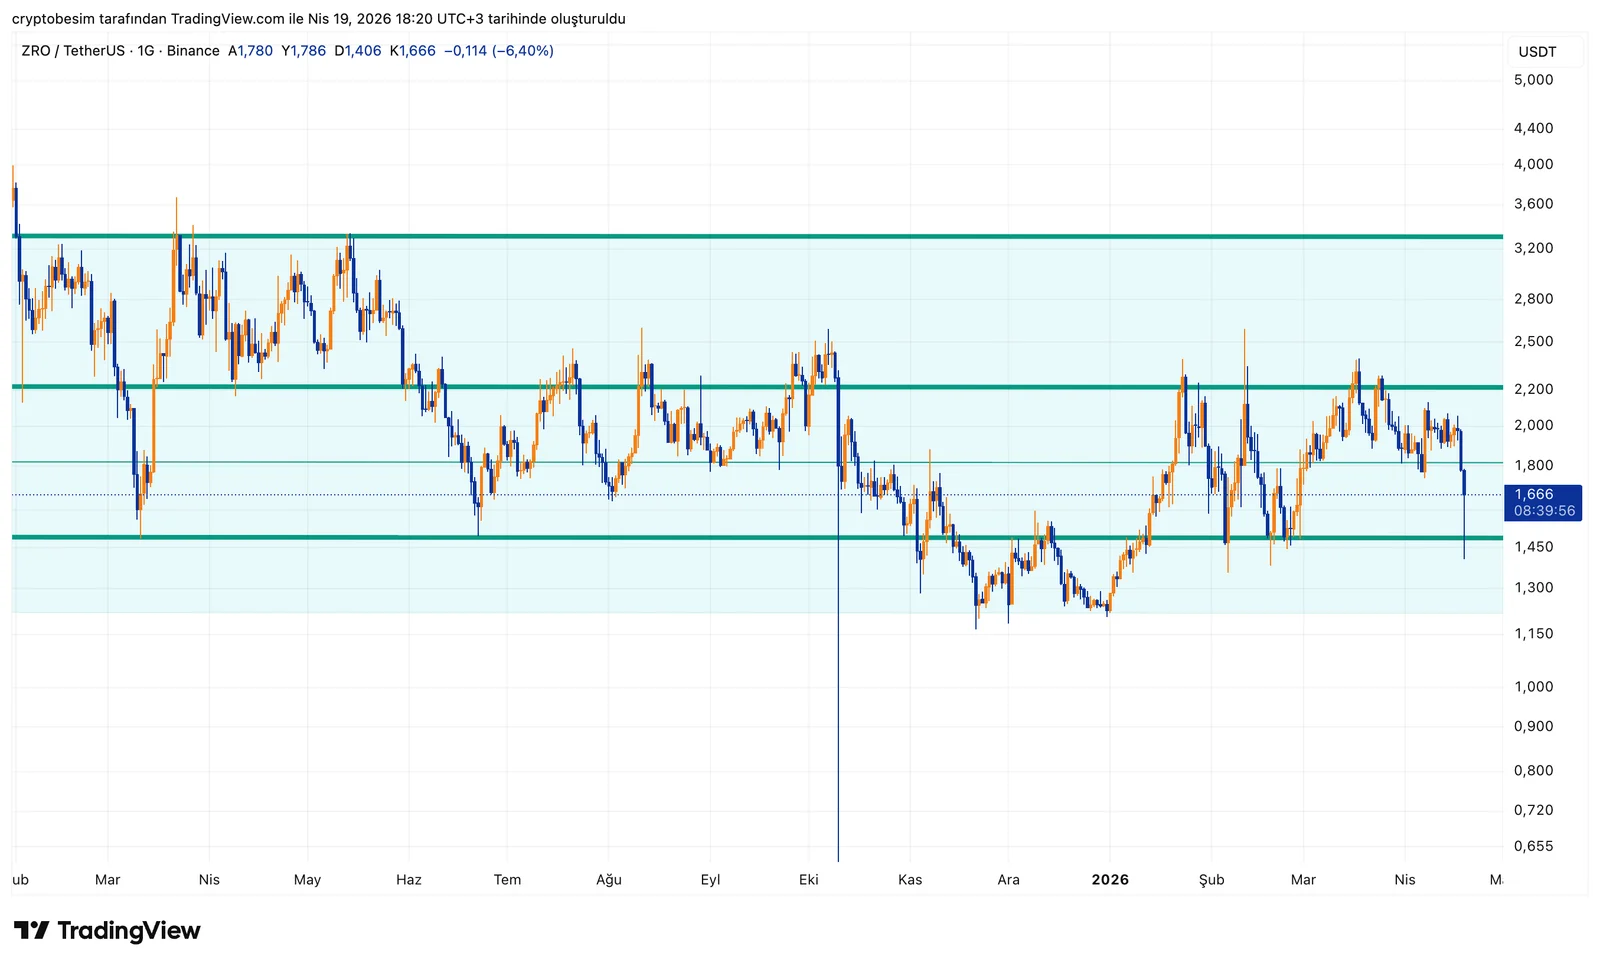
ZRO/USDT Technical Analysis
On the ZRO side, there has been a clear range structure for a long time, and price has once again moved toward the lower band. In these types of structures, instead of searching for direction, it makes more sense to read the movement within the range.
The current zone is around 1.60 – 1.65, which represents the lower support of the range. Price has reacted from this area several times before, meaning buyers tend to step in here. The current move also looks like a typical “lower band test.”
On the upside, the 2.20 – 2.30 range stands out as clear resistance. Throughout the range, price has faced selling pressure every time it reached this zone. So as long as it is not broken, the logic remains the same: buy near the lower band → target the upper band.
However, the critical point is this: the lower band weakens with each test. If this time price clearly breaks and closes below 1.60, the structure would be invalidated and a gap could open below. In that case, a quick pullback toward the 1.40 – 1.30 range may occur.
In the upside scenario, it is straightforward: if this support zone holds, price may again react toward the 1.90 – 2.20 mid and upper range.
In summary:
- 1.60 – 1.65 is strong support (range bottom)
- If price reacts here → targets are 1.90 and 2.20
- 2.20 – 2.30 is the main resistance
- A close below 1.60 → structure breaks
- Below that → fast pullback toward 1.40 – 1.30
- Currently in full range trading mode, aggressive directional expectations are risky without a breakout
These analyses do not provide investment advice and focus on support and resistance levels that are considered to offer short- and medium-term trading opportunities depending on market conditions. However, responsibility for execution and risk management lies entirely with the user. In addition, the use of stop loss is strongly recommended.


