
ZK/USDT Technical Analysis
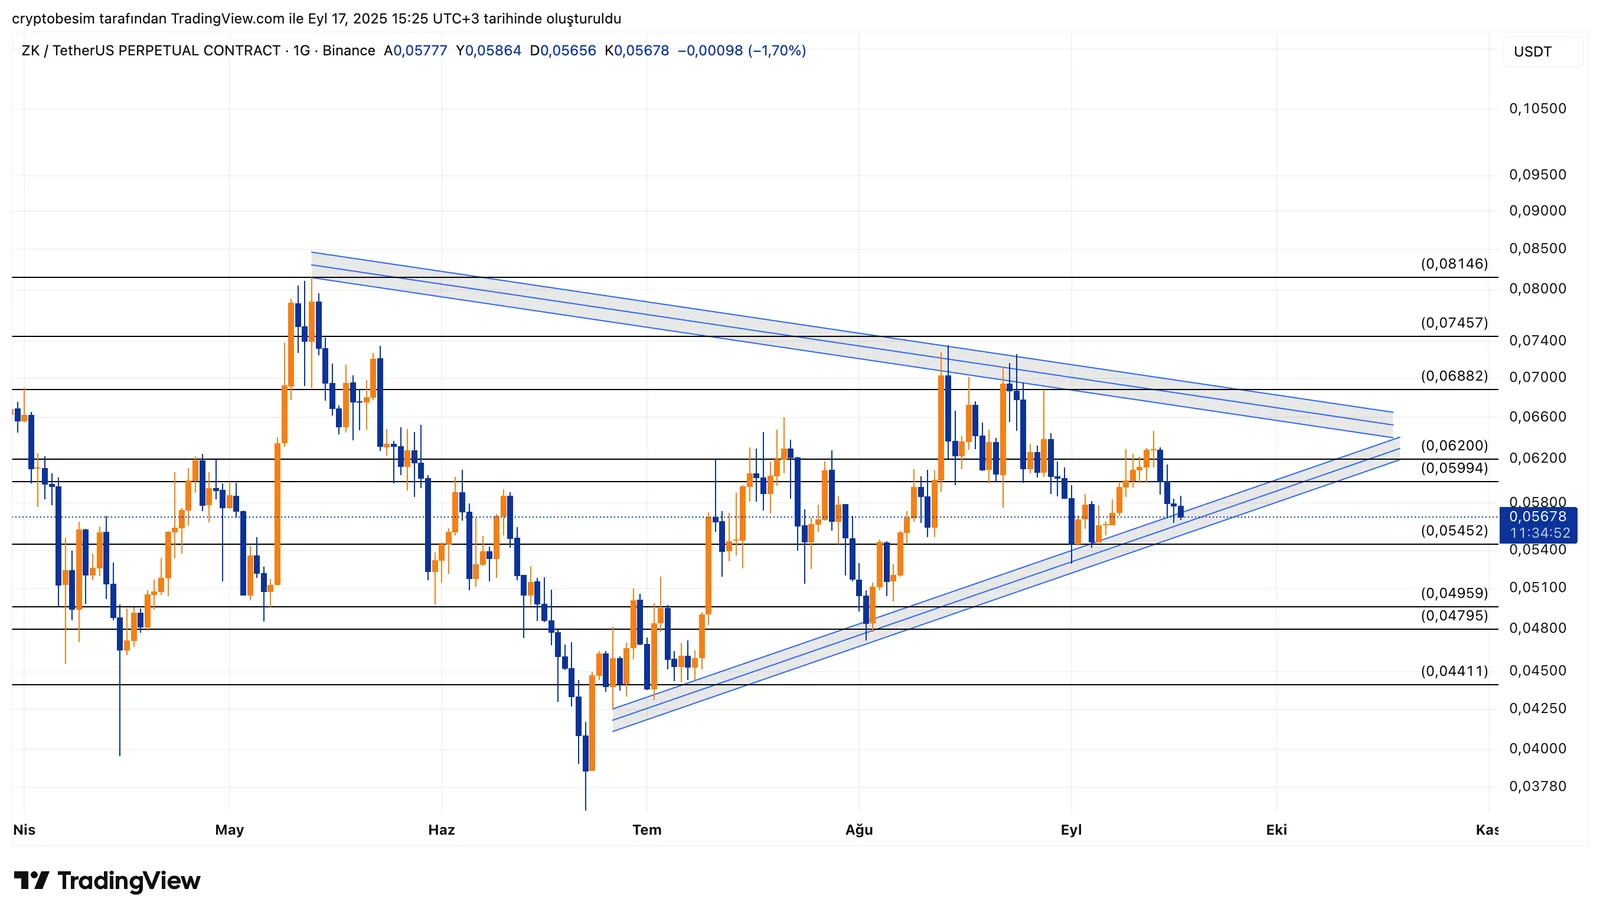
Analyzing ZK chart on a daily time frame, we see a symmetrical triangle formation shaping. The price has been trading between the downtrend line and ascending trend line coming from below. Such patterns usually have a potential to trigger a strong breakout and sharp moves following.
ZK is currently trading around the level $0.0567, close to the lower trend of the triangle formation. We see that the level at $0.0545 is a key support. The price might pull back to the levels $0.0495 and $0.0479 if it sees closings below the key support level.
According to a bullish scenario, the price is likely to test the resistance levels at $0.0599–$0.0620. Holding above these levels, ZK could go higher and target upper levels at $0.0688 and $0.0745. In the event that triangle formation gets broken above, then the price target would be $0.08 and above.
Summary:
- Price is trading close to the lower border of the triangle, $0.0545 is crucial support.
- Holding above the level $0.0599 will open way to $0.0688 and $0.0745.
- Trading below $0.0545 might trigger risky levels at $0.0495 and $0.0479.
These analyses, not offering any kind of investment advice, focus on support and resistance levels considered to offer trading opportunities in the short and medium term according to the market conditions. However, traders are responsible for their own actions and risk management. Moreover, it is highly recommended to use stop loss (SL) during trades.


