
XRP Technical Outlook
In the United States, spot XRP ETFs have now started trading and investor inflows into these products continue, which makes direct investment in XRP easier. In addition, the long-lasting lawsuit between Ripple and the SEC has finally been resolved, and this development has increased investor confidence. All of these steps show that XRP is not only staying on the agenda but has also entered the radar of a broader investor base.
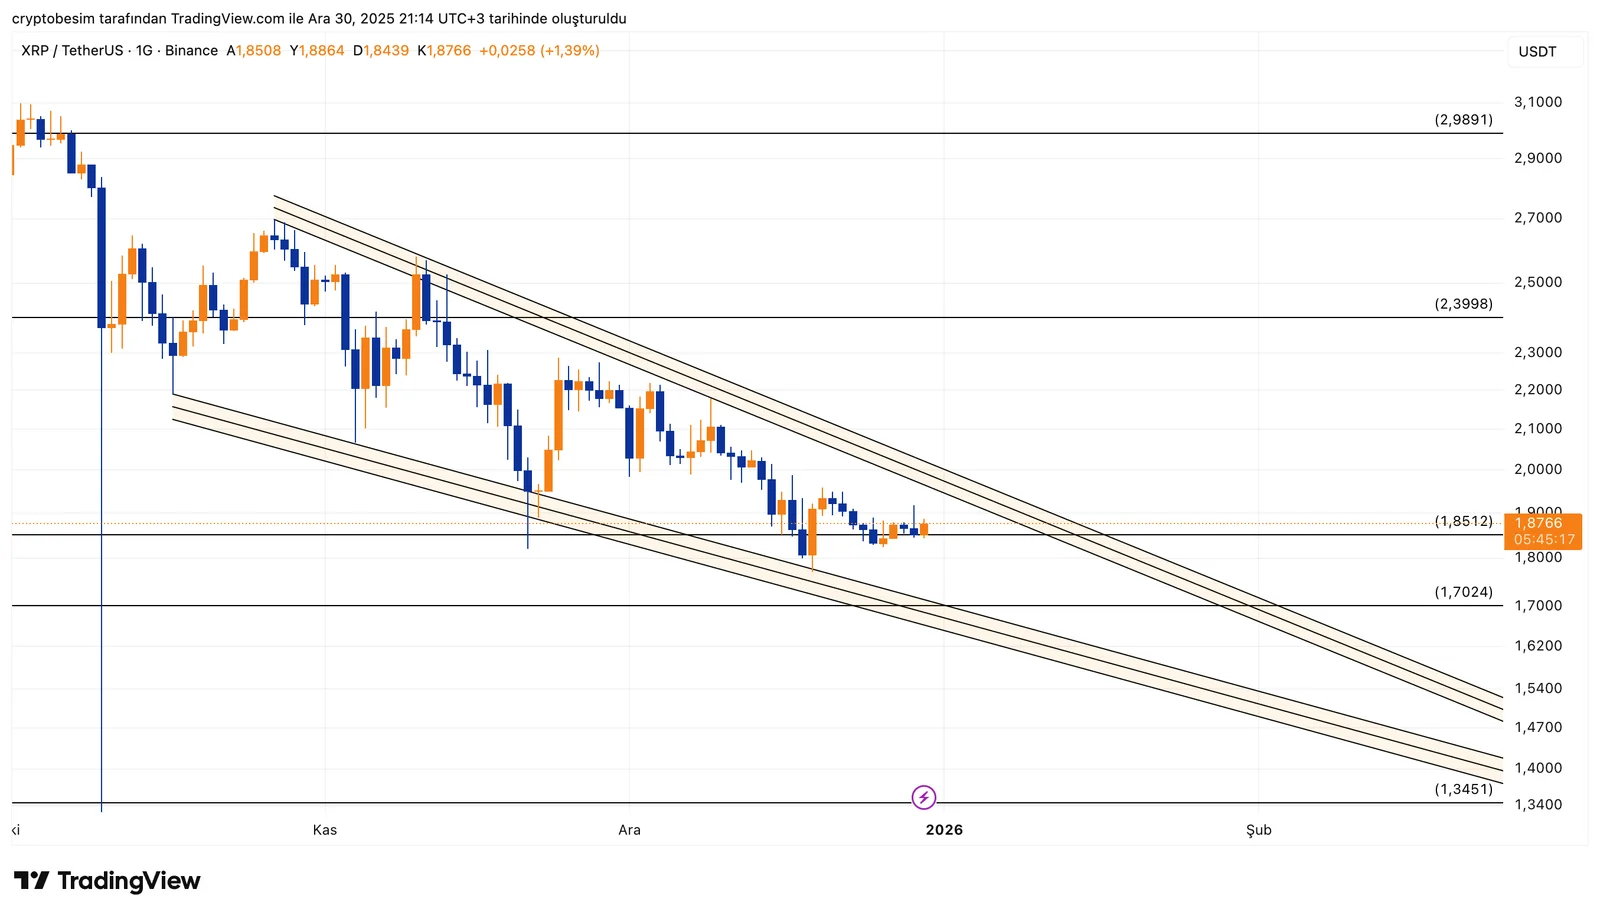
On the XRP side, the structure looks a bit more complex, but the message is actually clear. The price has been moving for some time within a compression formed by both a descending wedge and a descending–contracting triangle. The common point of these two formations is this: downside momentum is weakening, but the structural target is an upside breakout.
A descending wedge, when viewed on its own, carries upside breakout potential. However, here, in addition to the wedge, a descending trend and a contracting triangle are also in play. This tells us that the market is struggling to choose a direction and is building energy.
The price is currently in the middle region of the structure, meaning neither a clear support has been broken nor a relieving breakout has occurred.
The levels seen on the chart are:
- 2.98 – 3.00: Major peak in the big picture and psychological threshold
- 2.39 – 2.40: Previous main distribution zone
- 1.85 – 1.87: Center band of the current compression, balance area
- 1.70 – 1.72: Lower boundary of the contracting structure
- 1.34 – 1.35: Main support that will come into play if the structure breaks
In the short term, the most critical point is the horizontal compression around 1.85. The longer the price stays here, the sharper the move will be once a breakout comes. In an upside scenario, in line with the nature of the descending wedge, a rapid acceleration toward 2.10 first and then toward the 2.39 band may occur. However, for this scenario, a clear high-volume breakout of the upper trend is required.
On the downside, the risk is more straightforward. Closes below 1.70 resolve both the contracting triangle and the wedge structure to the downside. This pushes the price quickly toward 1.50 and then the 1.35 region. Especially in such double-formation structures, market participants caught on the wrong side accelerate the decline.
These analyses, which do not provide investment advice, focus on support and resistance levels that are thought to create short- and medium-term trading opportunities depending on market conditions. However, the responsibility for trading and risk management belongs entirely to the user. In addition, it is strongly recommended to use stop loss for the positions shared.


