
XRP Technical Analysis
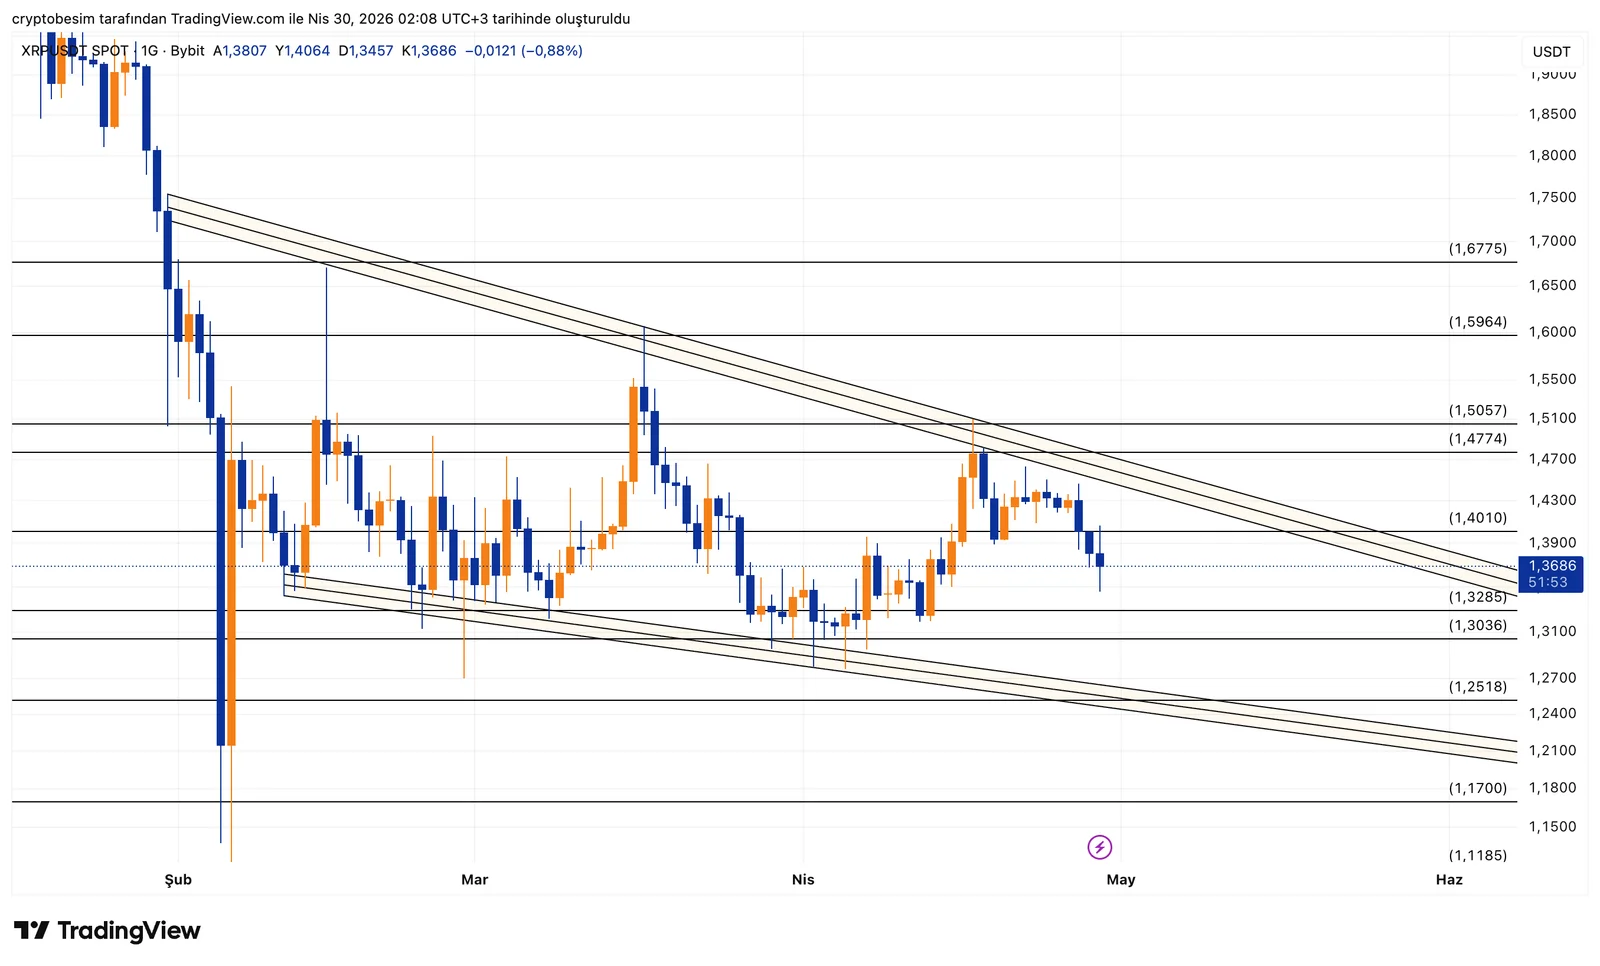
On XRP, price is still moving within a falling wedge, and it has now reached the upper boundary of the formation. This area is important because it has previously acted as a selling zone.
For the upside, the 1.40 – 1.41 range is the key level. If price closes above this zone, it would no longer be just a reaction but a confirmed breakout. In that scenario, the first target becomes 1.47 – 1.50, followed by a move toward 1.59.
On the downside, the 1.32 – 1.30 range is the level that needs to hold in the short term. If this area is lost, price may pull back into the formation and selling pressure could increase toward the 1.25 – 1.21 range.
In short, price is currently at a critical resistance. Without breaking the upper band, upward movement remains limited. If a breakout occurs, momentum accelerates; otherwise, selling pressure continues.
On the Ripple side, the recent development has been the activation of the RLUSD stablecoin across more than 280 trading pairs. This integration with OKX significantly expands its use in both spot and derivatives markets. With this move, the aim is to increase liquidity on the XRP Ledger and attract more users. Additionally, RLUSD being usable as collateral opens a new door for institutional participants. The overall picture shows a more concrete step toward generating real usage and volume within the ecosystem.
These analyses do not provide investment advice and focus on support and resistance levels that are considered to offer short- and medium-term trading opportunities depending on market conditions. However, responsibility for execution and risk management lies entirely with the user. In addition, the use of stop loss is strongly recommended.


