
XRP/USDT Technical Analysis
Analyzing the chart on a daily time frame, we see that XRP is still trading inside an upward channel. The price is currently consolidating near the lower band of the channel and the $2.44–$2.38 support zone, which is an area where strong buying was seen before.
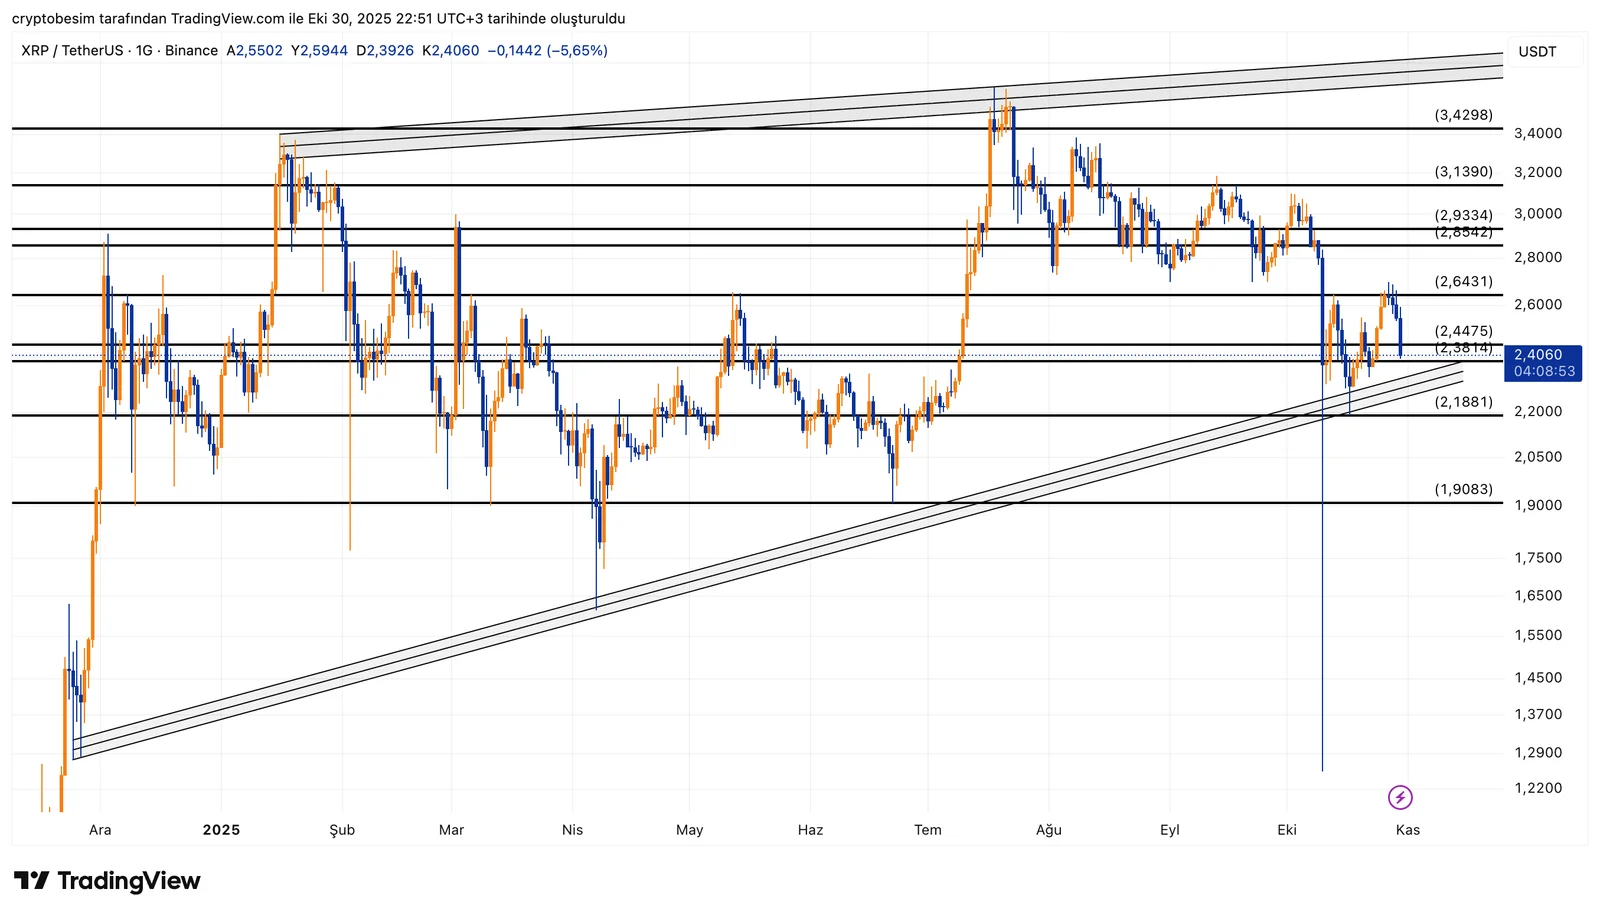
If XRP holds above this zone, a bounce toward the mid-channel becomes likely. The first resistance is at $2.64, and the next key level is $2.93, which matches both a horizontal barrier and the middle trend line. If XRP breaks above $2.93, the next target range could be $3.13–$3.42.
On the other hand, losing the $2.38 support could weaken the channel and bring more selling pressure, possibly pushing the price down to $2.18. The next strong support below that sits around $1.90.
- Summary• XRP is holding above the lower trend and key horizontal support.• The $2.38–$2.44 area is crucial for a potential rebound.• Watch $2.64 → $2.93 as resistance zones.• A close below $2.38 could trigger deeper losses.
These analyses, not offering any kind of investment advice, focus on support and resistance levels considered to offer trading opportunities in the short and medium term according to the market conditions. However, traders are responsible for their own actions and risk management. Moreover, it is highly recommended to use stop loss (SL) during trades.


