
WLD Technical Analysis
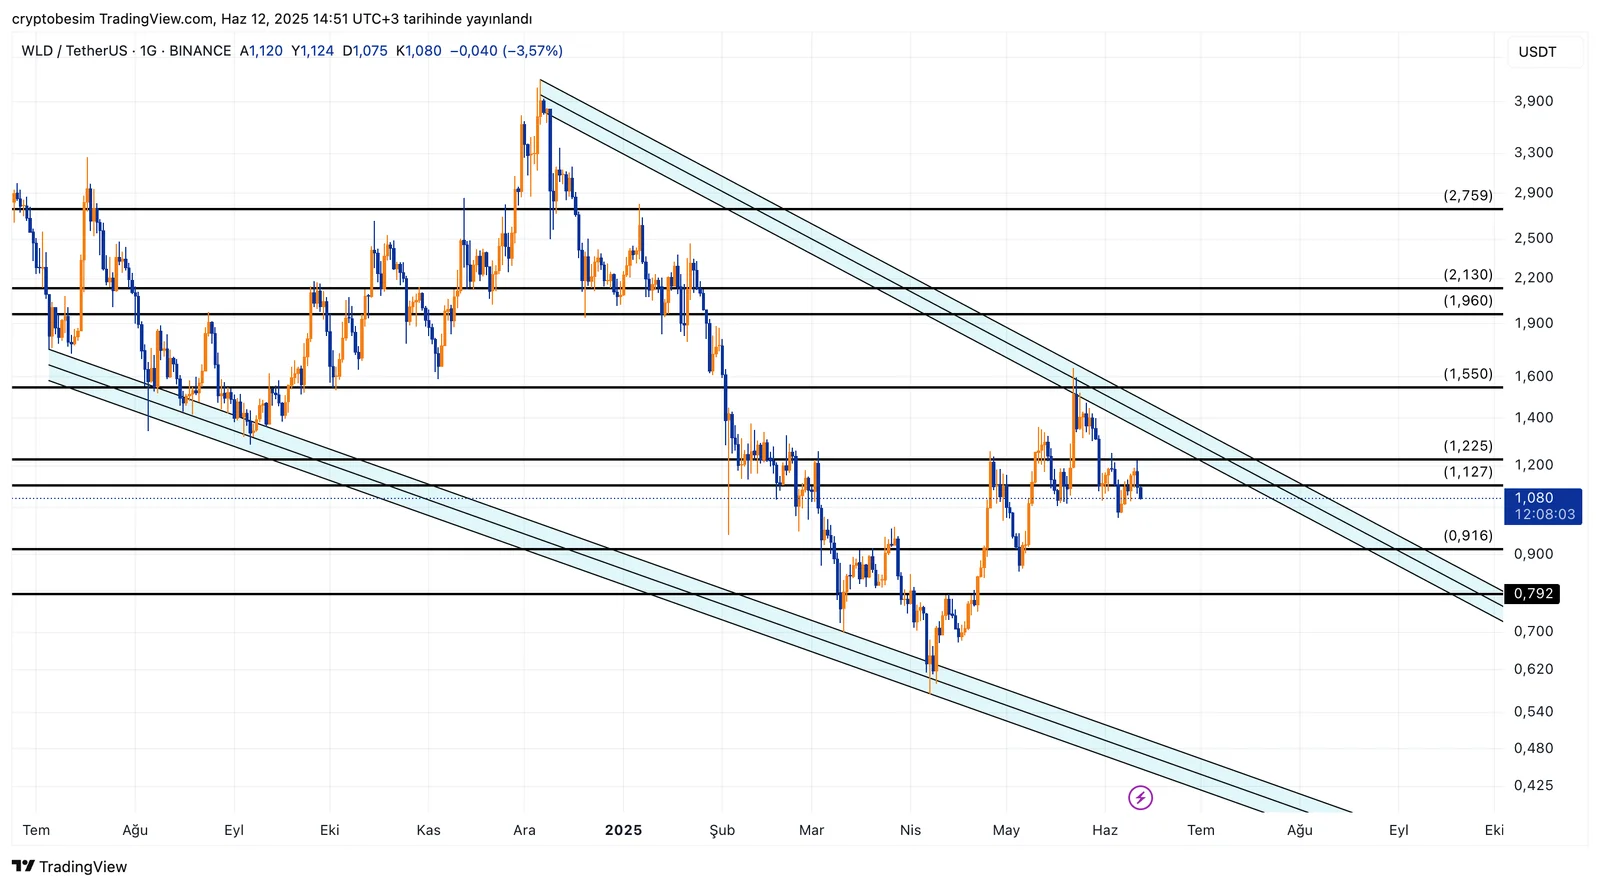
WLD is currently moving within a classic falling wedge pattern on the daily chart. This formation is generally considered a bullish structure, especially when it forms at lower levels, as it often results in an upward breakout. The price is currently around $1.08 and is positioned near the midline of the wedge.
The price nearing the upper boundary of this narrowing structure increases the likelihood of a breakout. The continued decline in trading volume indicates a typical formation process. Technically, such a consolidation phase often sets the stage for a strong upward move if the breakout is supported by volume.
If a breakout occurs, the following levels can be targeted in the medium term:$1.22 → $1.55 → $1.96 → $2.13Surpassing these levels could pave the way for the price to test higher targets around $2.75.
For the formation to be considered invalid, the price would need to drop back below $0.91 and break the $0.79 level. However, the current technical outlook suggests that a decline to these levels is a less likely scenario. A breakout on the daily chart with strong volume and a close above $1.13 would be the most critical technical signal to trigger this bullish scenario.
As long as the formation remains intact, upward price action appears more likely for WLD.


