
WLD Technical Analysis
Positive developments continue to unfold around Worldcoin (WLD). A Nasdaq-listed company recently announced that it will include WLD tokens in its treasury holdings. This can be considered a move suggesting that the project is now being recognized not only as a digital identity solution but also as a potential store of value among institutional and retail investors. This development reinforces the network’s real-world utility and hints at potential trend shifts on the price charts.
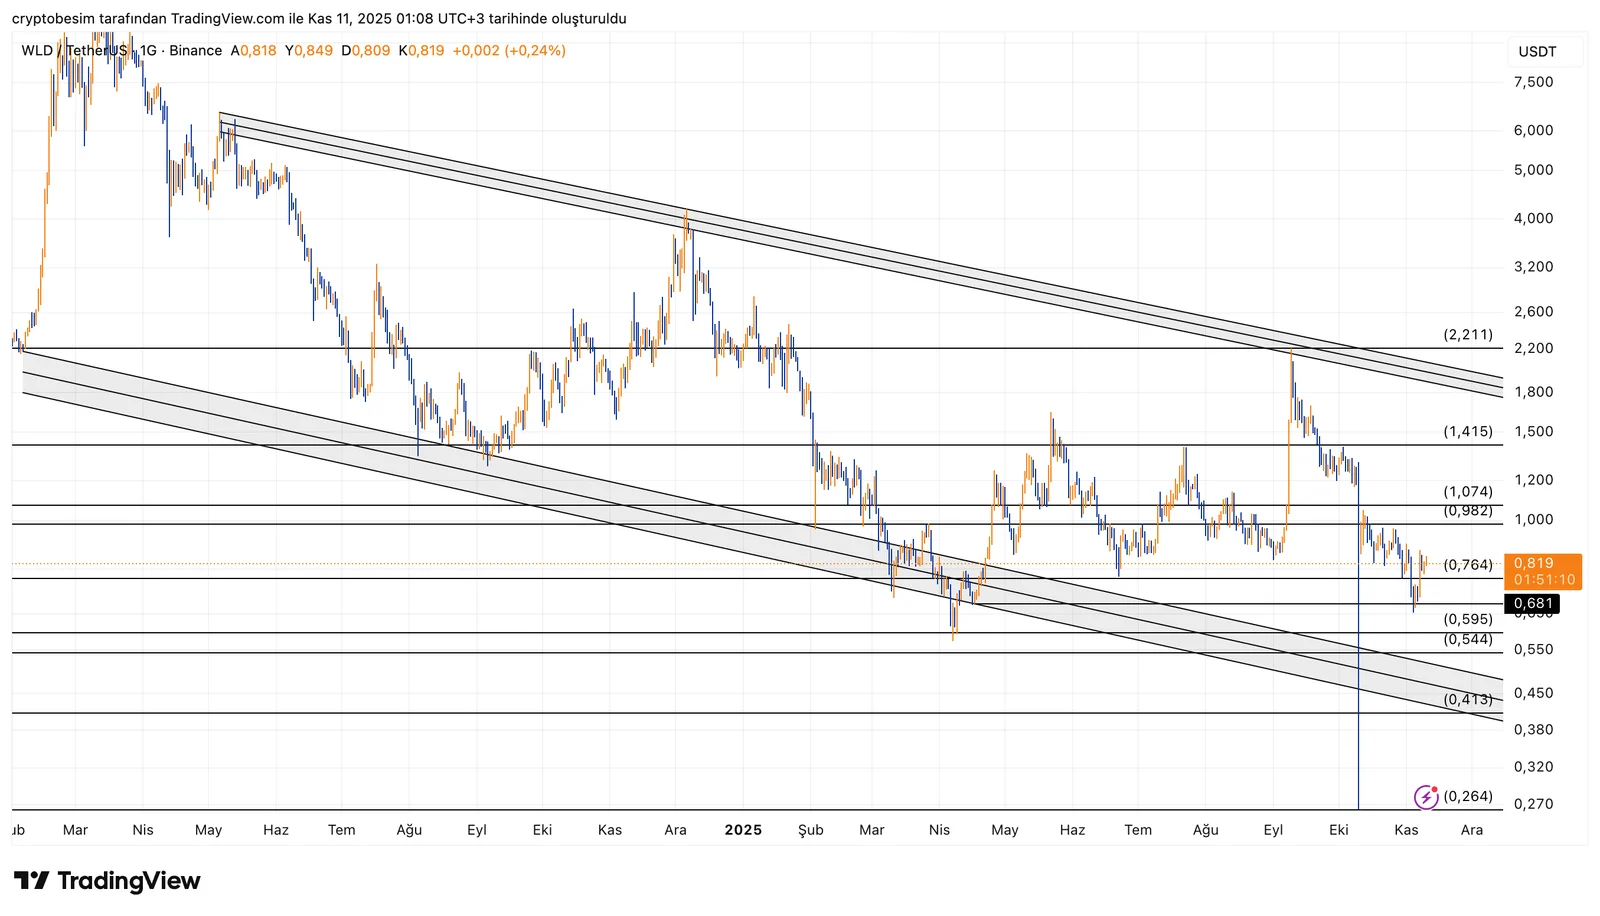
Analyzing the chart on the daily timeframe, we see that the coin is trading within a descending wedge pattern. This formation typically indicates the final stage of a downtrend and carries bullish reversal potential. The price is currently consolidating near the midline of the wedge, showing early signs of stabilization.
The $0.68–$0.76 range serves as a key horizontal support zone in the short term. Sustained closes above this level could strengthen the recovery momentum. The $0.98–$1.07 area aligns with the wedge’s upper midline and represents the first major resistance zone. A decisive breakout here could validate the wedge structure and trigger a trend reversal confirmation.
On the other hand, daily closes below $0.68 would imply a breakdown beneath the wedge, exposing the price to further declines toward $0.59–$0.54, which aligns with the previous cycle’s low.
- Support and Resistance Levels
- Support levels: $0.68 – $0.59 – $0.54
- Resistance levels: $0.98 – $1.07 – $1.41 – $2.21
These analyses, not offering any kind of investment advice, focus on support and resistance levels considered to offer trading opportunities in the short and medium term according to the market conditions. However, the user is responsible for their own actions and risk management. Moreover, it is highly recommended to use stop loss (SL) during the transactions.


