WLD Technical Analysis
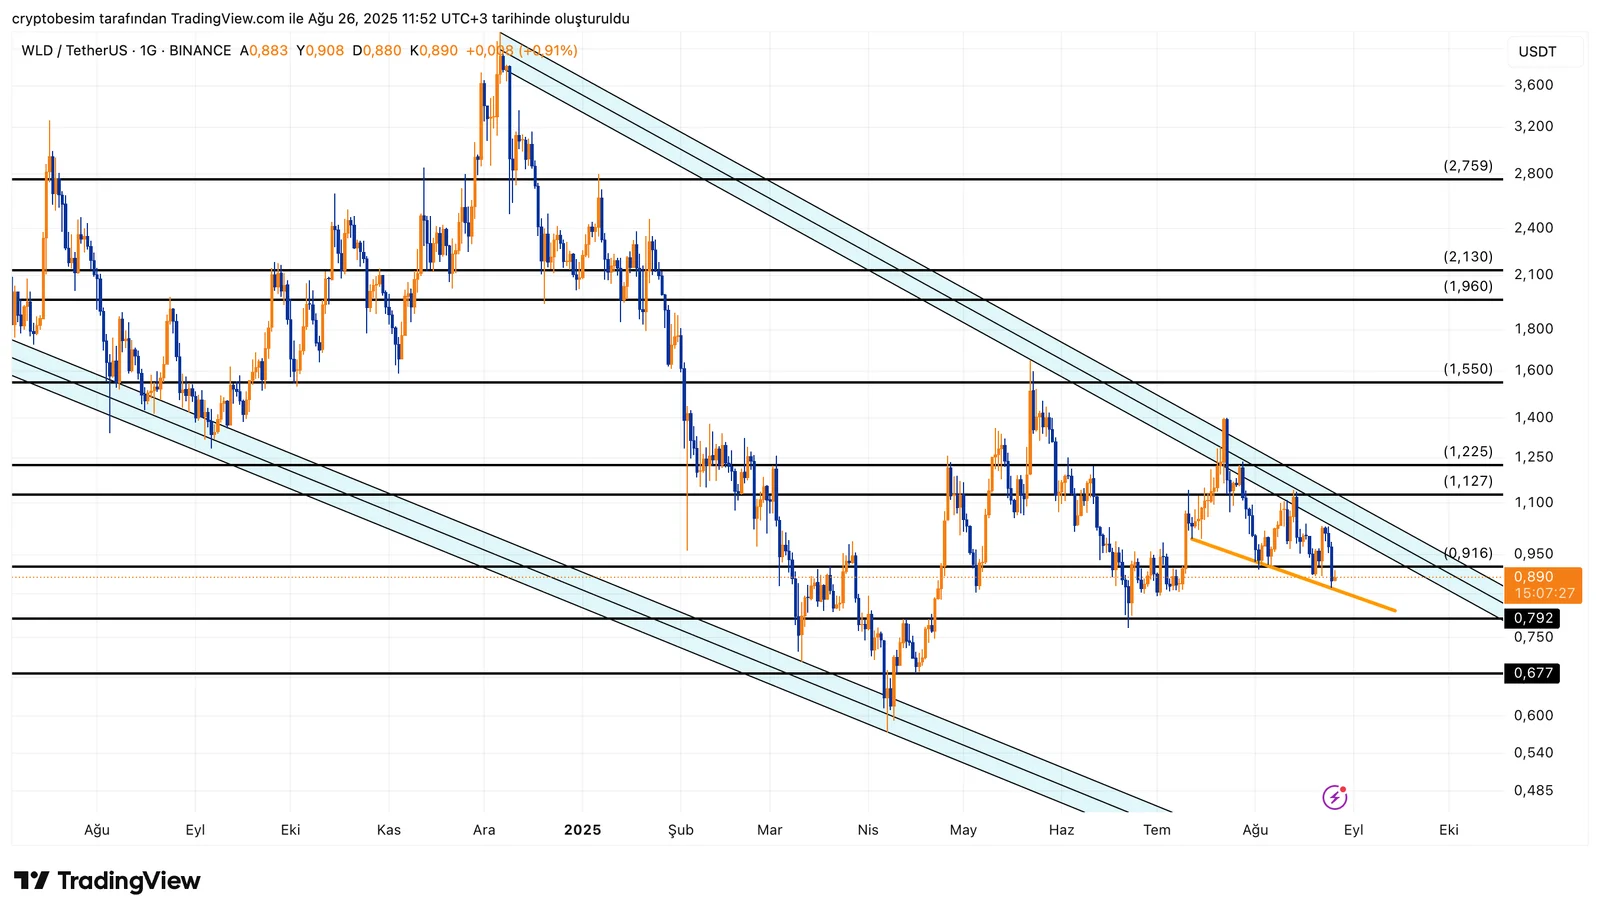
WLD’s chart has been following a structure that began in mid-2024 and continues to trade within it to this day. This structure can be defined as a falling wedge formation, which has been shaping the chart in a consistent manner. The primary target of this formation is an upward breakout, with the $4 region as a potential post-breakout objective. Remaining within this structure in the long term is a positive signal.

In the short term, we can see that the price has frequently touched the upper band of the falling wedge recently. This indicates that the trend resistance is weakening. At the moment, both the trend resistance and a horizontal resistance zone are intersecting. The $1.12 – $1.22 resistance range forms the main selling zone alongside the trendline. Pullbacks from this area would be quite natural. Maintaining support above $0.91 will preserve the positive outlook. Each subsequent touch to the trendline will bring the price closer to a breakout. On the downside, the $0.91, $0.85, and $0.79 levels will be the key supports to watch, while on the upside, the falling wedge’s trend resistance, along with $1.12, $1.22, and $1.55, will serve as the nearest resistance levels.
These analyses do not constitute investment advice and focus on support and resistance levels that may present potential trading opportunities in the short and medium term, depending on market conditions. However, the responsibility for executing trades and managing risk lies entirely with the user. It is also strongly recommended to use stop-loss orders for any trades mentioned.


