
UNI/USDT Technical Analysis
On the Uniswap side, as of March 2026, the most important topic has been the governance vote on the protocol’s revenue model. The discussion focuses on directing a portion of trading fees to the protocol and linking it with UNI. This is seen as a development that could change UNI’s valuation structure. Despite this, price action remains volatile. Therefore, it is important to observe how this decision process is reflected in the technical chart.
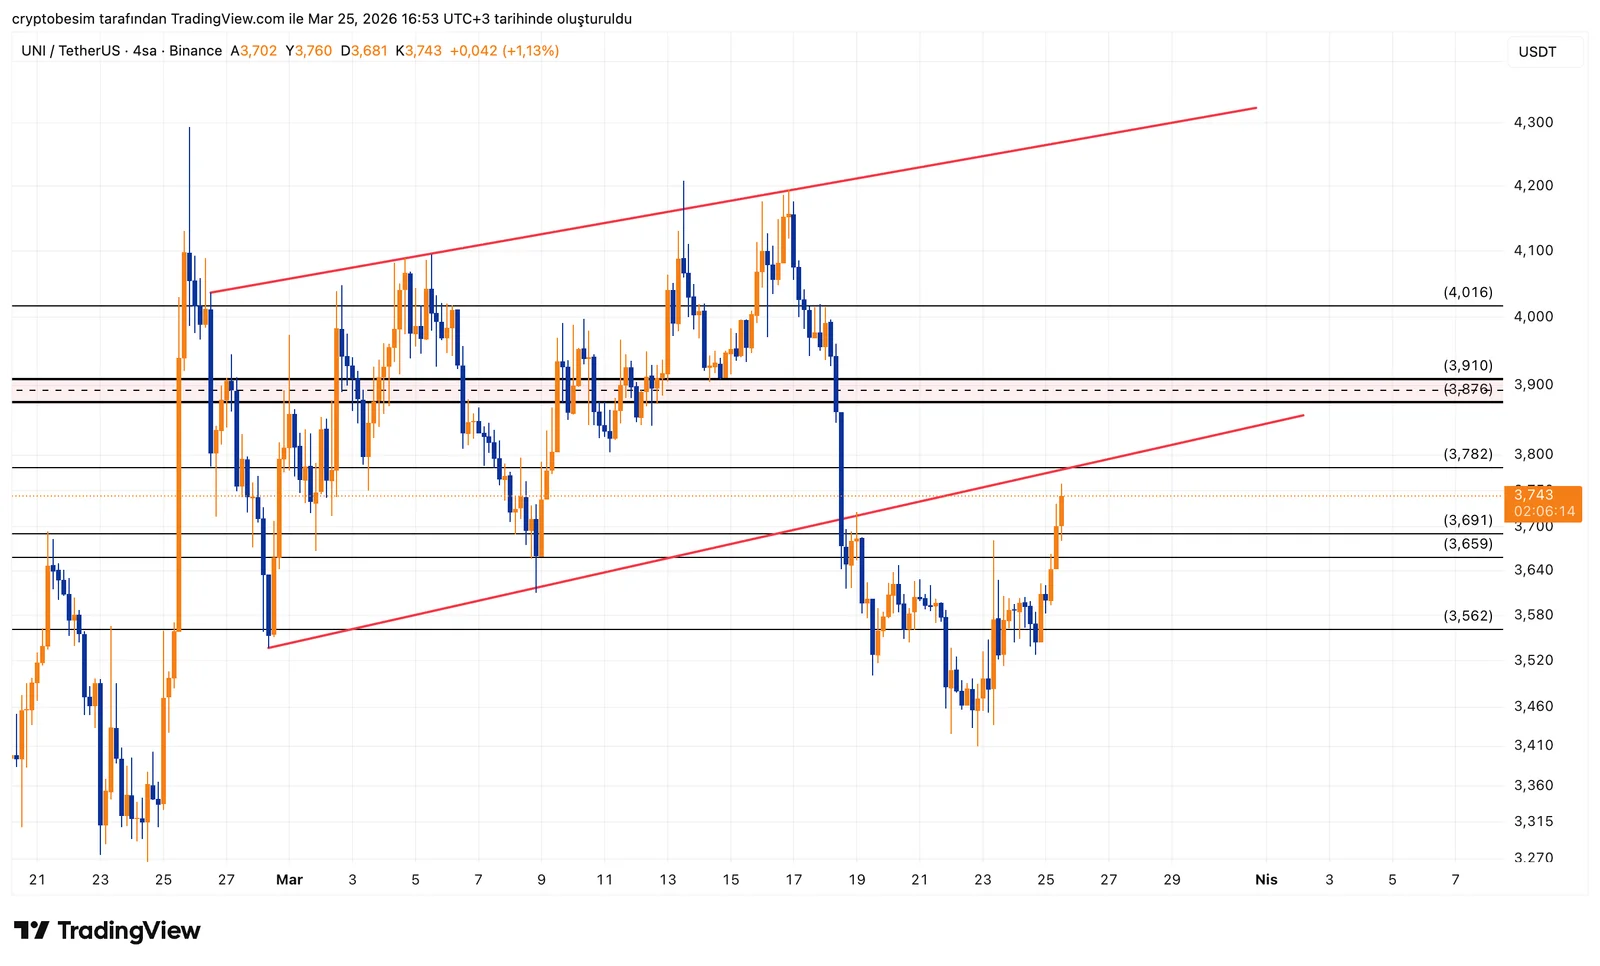
On the technical side, the recovery after the recent drop is notable. Price is attempting a move upward after reacting from lower levels, but it is still too early to talk about a strong trend.
Currently, price is moving around the 3.70–3.75 range. On the upside, the 3.87–3.91 zone is an area where price previously struggled. If price moves toward this region, encountering selling pressure at first would be normal. Without breaking this level, it is difficult to say that the upward move has become comfortable.
On the downside, the 3.65–3.69 range appears to act as a short-term support zone. Before the recent upward move, price found support here and bounced. Therefore, in a possible pullback, looking for a reaction from the same area would be more reasonable.
Selling pressure appears above, while buying interest supports below. This creates a balanced structure. As long as 3.90 is not broken, upward attempts may remain limited. As long as 3.65 holds, pullbacks may not deepen.
These analyses do not provide investment advice and focus on support and resistance levels that are considered to offer short- and medium-term trading opportunities depending on market conditions. However, responsibility for execution and risk management lies entirely with the user. In addition, the use of stop loss is strongly recommended.


