TRX Technical Analysis
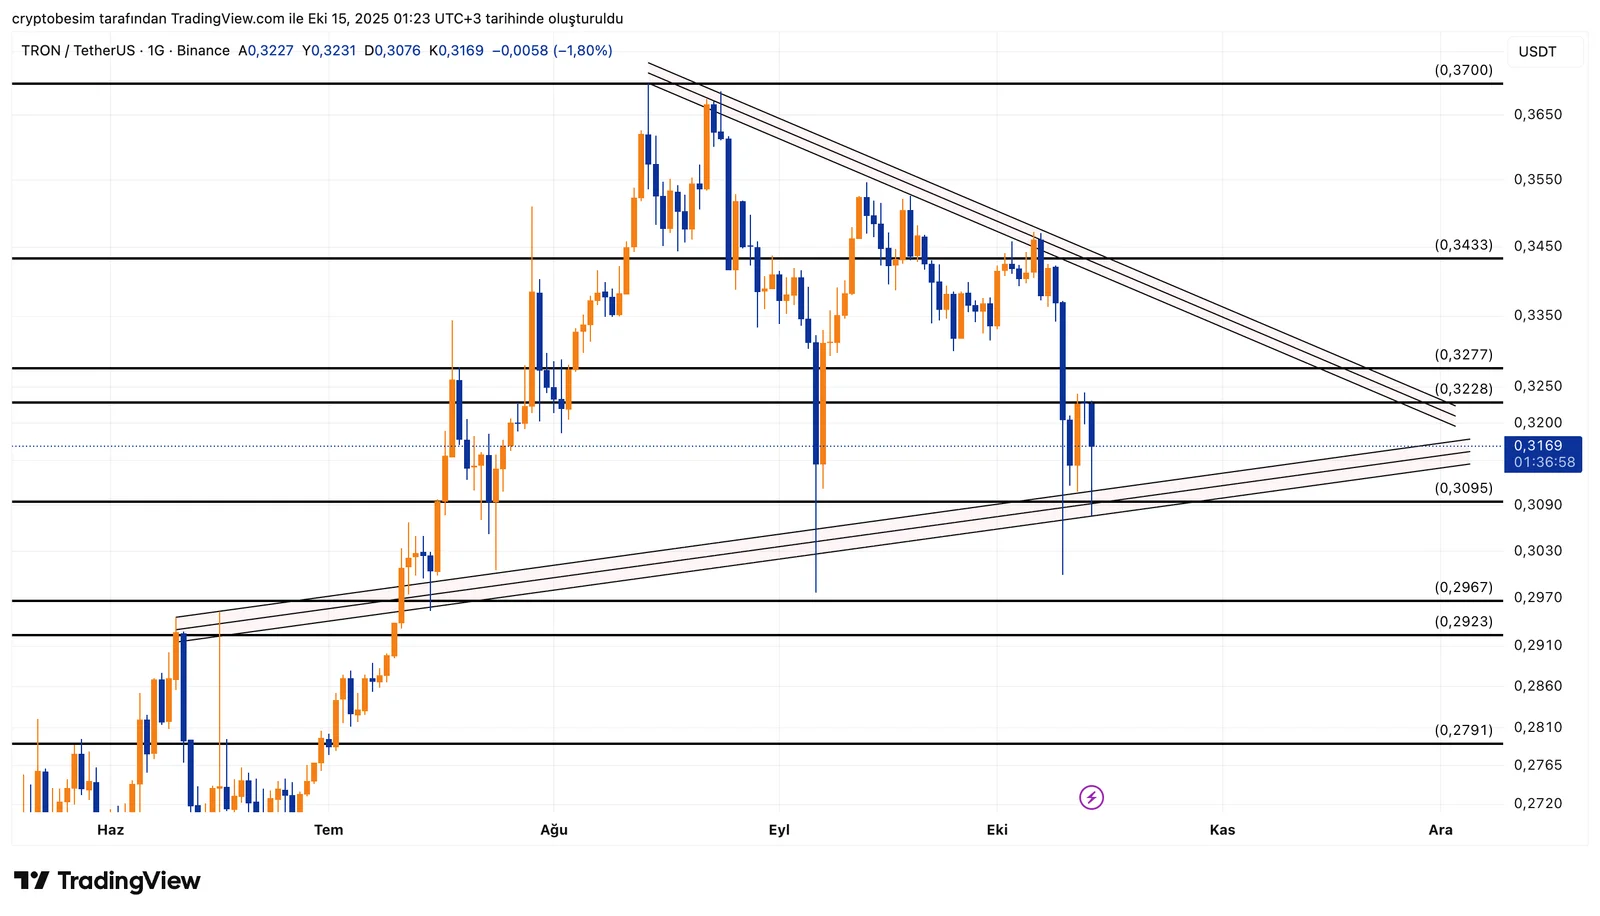
Looking at the TRX chart, we can clearly see a symmetrical triangle formation taking shape.This pattern usually signals that the market is reaching the final phase of consolidation before a strong directional breakout. TRX is currently trading around $0.3169. The key short-term resistance sits at $0.3228, which also aligns with the upper border of the triangle. If the price manages to break above this level, we could see moves toward $0.3277 and $0.3433. A strong breakout above $0.3433 would confirm a bullish breakout, opening the door for a move toward $0.370.
The level at $0.3095 is the critical support zone below. If the price closes below this level, we could see a drop toward $0.2967 and even $0.2791. The lower band of the triangle also sits near $0.309, making this area essential for maintaining the structure.
Overall, the market is still in a tight consolidation phase, waiting for direction. Given the current momentum and volume profile, the probability of an upside breakout appears slightly higher.

In summary:
- TRX is moving within a symmetrical triangle pattern.
- Current price: $0.3169
- Key resistances: $0.3228 and $0.3277
- Above $0.3433, the next target is $0.370
- Support levels: $0.3095, $0.2967, and $0.2791
- The breakout direction will determine the next major move — volatility likely to rise soon.
These analyses, not offering any kind of investment advice, focus on support and resistance levels considered to offer trading opportunities in the short and medium term according to the market conditions. However, traders are responsible for their own actions and risk management. Moreover, it is highly recommended to use stop loss (SL) during trades.


