Crypto Market at the 2025 Peak: Will the Bull Continue After the FOMC? [Detailed TOTAL Analysis]
Technical Structure: Historical Resistance Zone and 5-Year Trend
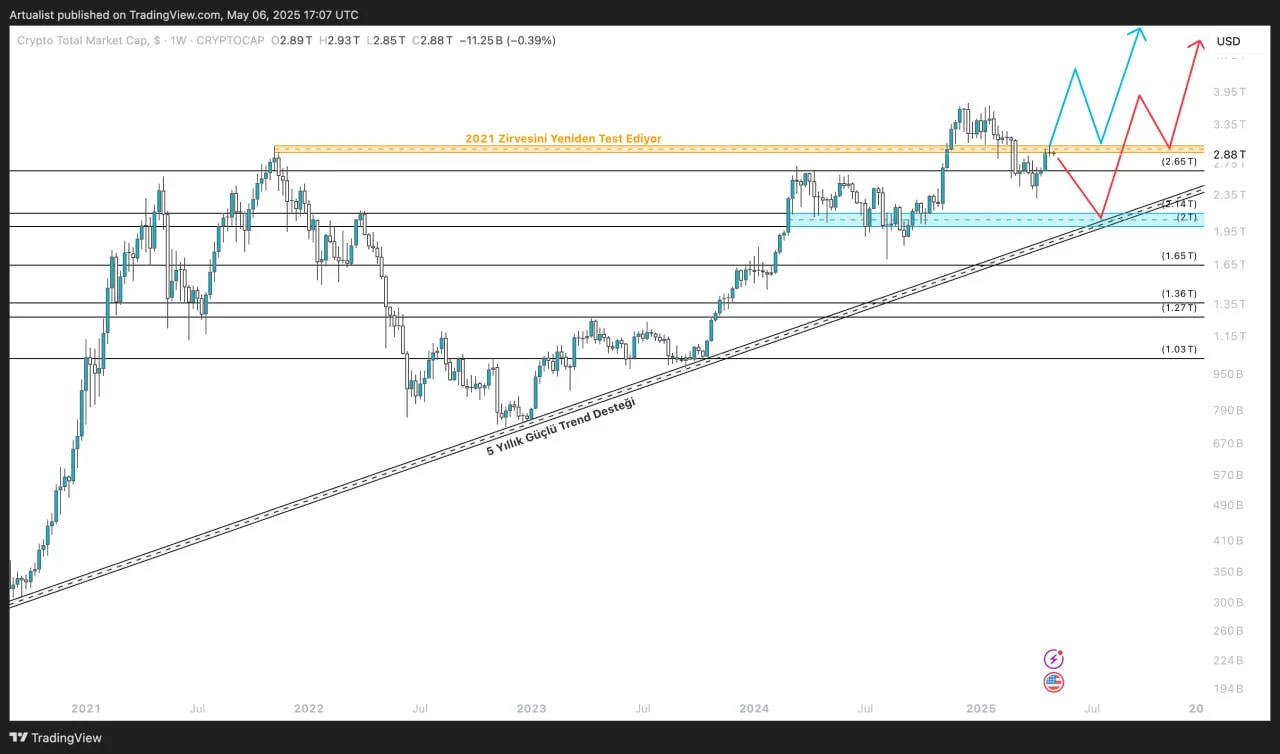
The 2.85T – 2.95T USD region is the peak of the 2021 bull season. This zone acts as a macro resistance line that has not yet been broken. Currently, we are seeing weekly closes just below this line. This indicates that the market is at a critical decision point regarding this level.

Below that, around 2.15T USD, lies the ascending trend support that has been in place for 5 years. This trend line is essentially the backbone of the bull cycle that started after the pandemic and is still valid today.
This structure tells us two things:
- a) Either the market will clearly break through the 2021 peak and initiate a new super bull,
- b) Or it will once again get rejected in this region and pull back to major supports to regain strength.
Despite short-term declines, the weekly structure shows that ETH is still preparing for a mid-term upward move.
Post-FOMC Expectations on May 7: Blue and Red Scenarios
Blue Scenario (Positive FOMC → New Bull Wave)
In this scenario, if the FED uses a non-hawkish tone in the May 7 meeting, leaves the door open for rate cuts, and emphasizes that "sufficient tightening has been achieved" in the fight against inflation, risk markets could respond with great enthusiasm.
In this case, the 2.85T region on the chart would be clearly broken, followed by a healthy retest of that region. Then, the market could head toward the 3.35T USD and higher targets. If this is supported by developments like the Ethereum Pectra Upgrade and spot altcoin ETF applications, we could witness the strongest rally since 2021.
Let’s not forget: historically, low volatility + positive divergence after an FOMC has often been the trigger for major bull runs.
Red Scenario (FOMC Uncertainty or Short-Term Pressure)
In this scenario, even if the FED keeps rates steady, if it uses cautious language regarding inflation, or if markets interpret that "rate cuts are not imminent", or if the 2.85T – 2.95T line cannot be decisively broken; rejection and correction become more likely.
Here, the market could first pull back to the 2.65T region, and possibly to the 2.15T – 2.00T zone around the main ascending trend. Such pullbacks often generate high demand in POI (Point of Interest) regions. Especially the trend line zone could, as in the past, serve as an accumulation zone for large funds.
However, even in this scenario, the bull structure remains intact. We’re merely talking about a correction to regain balance and market saturation.
Macro Trend Continues: 5-Year Support Still Intact
- The most important positive signal is that the 5-year ascending trend is still valid.
- There hasn’t been a single weekly close below this trend.
- Even in the harshest sell-offs of the 2022 bear season, this trend was preserved.
Where we stand today, there’s a structure squeezed between this trend and the 2021 peak. This structure typically indicates an “expansion after compression” model. By nature, such squeezes in bull markets usually break to the upside. If the fundamental triggers listed above (ETFs, rate cut signals) come into play, this breakout could initiate a new ATH wave.
ETH/BTC Chart: Historical Lows in Favor of Ethereum

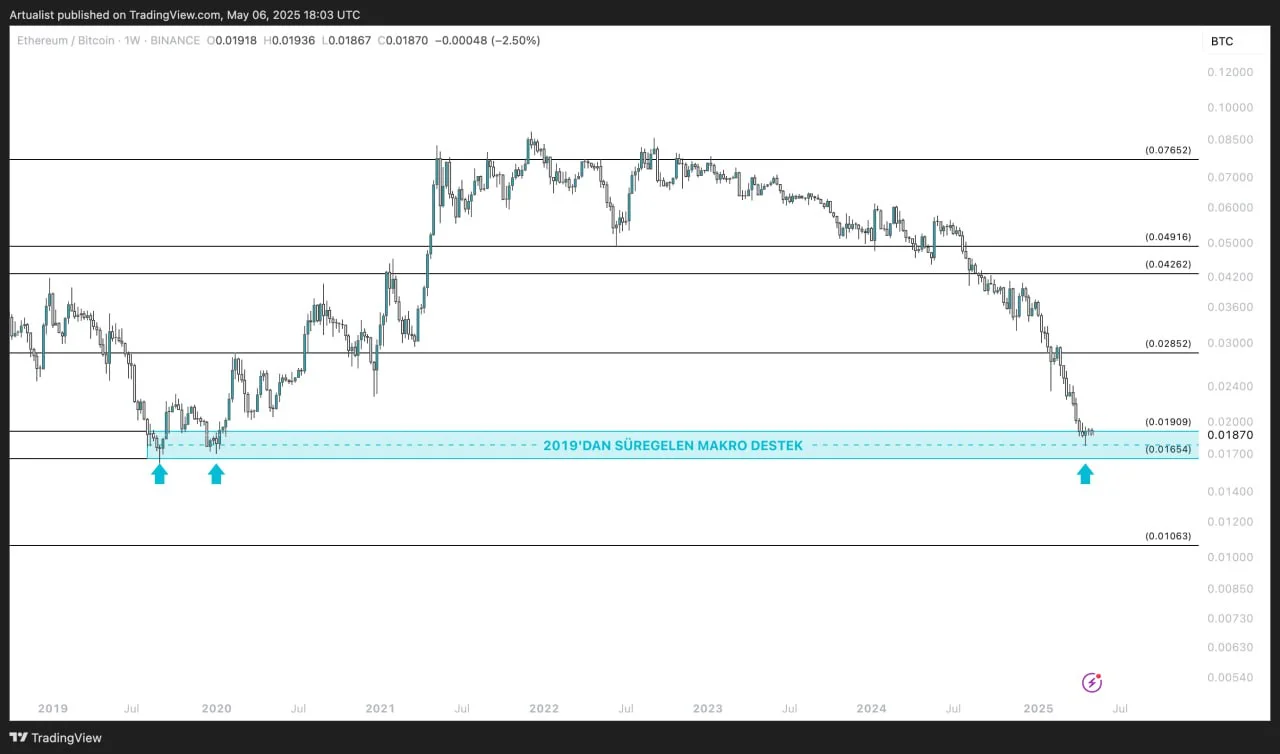
Now let’s look at this structure from the ETH/BTC perspective. The ETH/BTC ratio is currently at levels seen before Ethereum’s major surge in 2021. This ratio is at historical low levels, meaning Ethereum has high potential to gain value against BTC.
Considering both Ethereum’s technical structure and ETF speculation, this structure suggests that the altcoin season may start under Ethereum’s leadership. In summary, we are in a structure where Ethereum may gain value not only in USD terms but also against BTC in the coming weeks.
Conclusion: A Market Awaiting Bull Confirmation
- The market is still within a macro upward trend.
- Price is struggling with historical resistance.
- If the blue scenario kicks in post-FOMC, a new super bull season may begin.
- The red scenario still points to a healthy correction; as long as the trend isn't broken, the bull structure remains.
- ETH/BTC is open to strengthening in favor of Ethereum.
Therefore, the market is closer to the positive scenario. With a breakout above this region, which represents the 2021 peak, we could see a total market cap of first 3.35T and then 4.0T in the short term.
These analyses, which do not provide investment advice, focus on support and resistance levels where short and medium bid trading opportunities can be created according to market conditions. However, the user is solely responsible for trading and risk management. In addition, it is strongly recommended to use stoploss in relation to replacement transactions.


