TON/USDT Technical Analysis
On the Toncoin side, the recent focus has been on updates aimed at making network usage easier. Newly announced tools for developers simplify application building and enable users to make direct payments more efficiently. Ecosystem events and community meetups also show that the project remains active. However, despite these developments, price action remains volatile. For this reason, it is important to evaluate how increased usage efforts are being reflected on the technical chart.
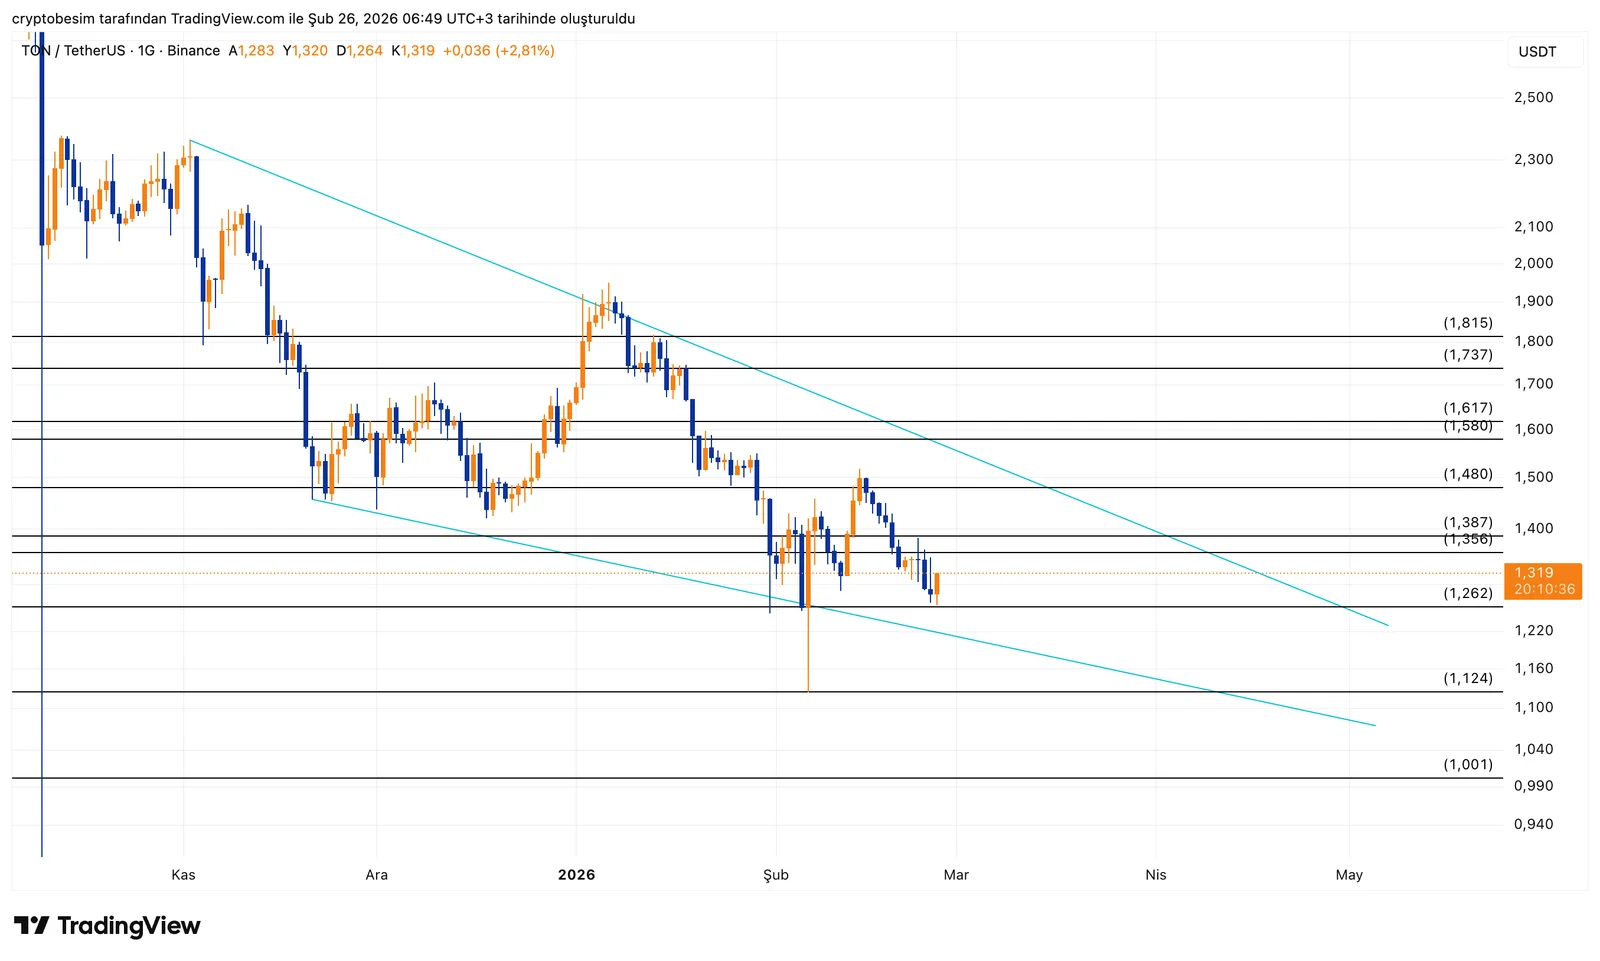
On the daily timeframe, a clear falling wedge formation is visible. As the lower and upper bands converge, price is tightening within the structure. Technically, this setup carries upside breakout potential, but confirmation is required.
Price is currently trading near the wedge’s lower band.The 1.26 – 1.24 region serves as short-term support. If this zone holds, the probability of an upside attempt increases.
Upside scenario:A breakout above the wedge’s upper band and sustained price action above 1.38$ → first 1.48$, followed by the 1.58 – 1.61$ band become targets. Structural strengthening becomes clearer with daily closes above 1.61$.
Downside scenario:Loss of the lower band → 1.12$, followed by the 1.00$ region comes into focus. In this case, the formation becomes invalid.
- Summary:Falling wedge structure remains activeBreakout direction will be decisiveUpper band break → momentum expansionLower band loss → structural weakening
These analyses do not provide investment advice and focus on support and resistance levels that are considered to offer short- and medium-term trading opportunities depending on market conditions. However, responsibility for execution and risk management lies entirely with the user. In addition, the use of stop loss is strongly recommended.


