
TON/USDT Technical Analysis
Analyzing the chart on the 4-hour time frame, we see that the coin is displaying a short-term recovery after a sharp drop, bouncing strongly from the 1.89 support level. The coin is currently trading around 1.96, approaching regions that align with Fibonacci retracement levels — areas that often indicate potential pullback zones.The first target area stands between 2.06 and 2.12, which corresponds both to a prior horizontal resistance zone and the Fibonacci 0.50–0.618 retracement range. Therefore, selling pressure may increase within this region. If a breakout occurs and daily closes form above 2.15, the recovery could extend toward 2.22.On the other hand, the 1.90–1.89 range represents a key short-term support zone. This area acted as a strong reaction point during the last decline and remains critical for the current trend structure. A break below it could trigger a further pullback toward 1.84.
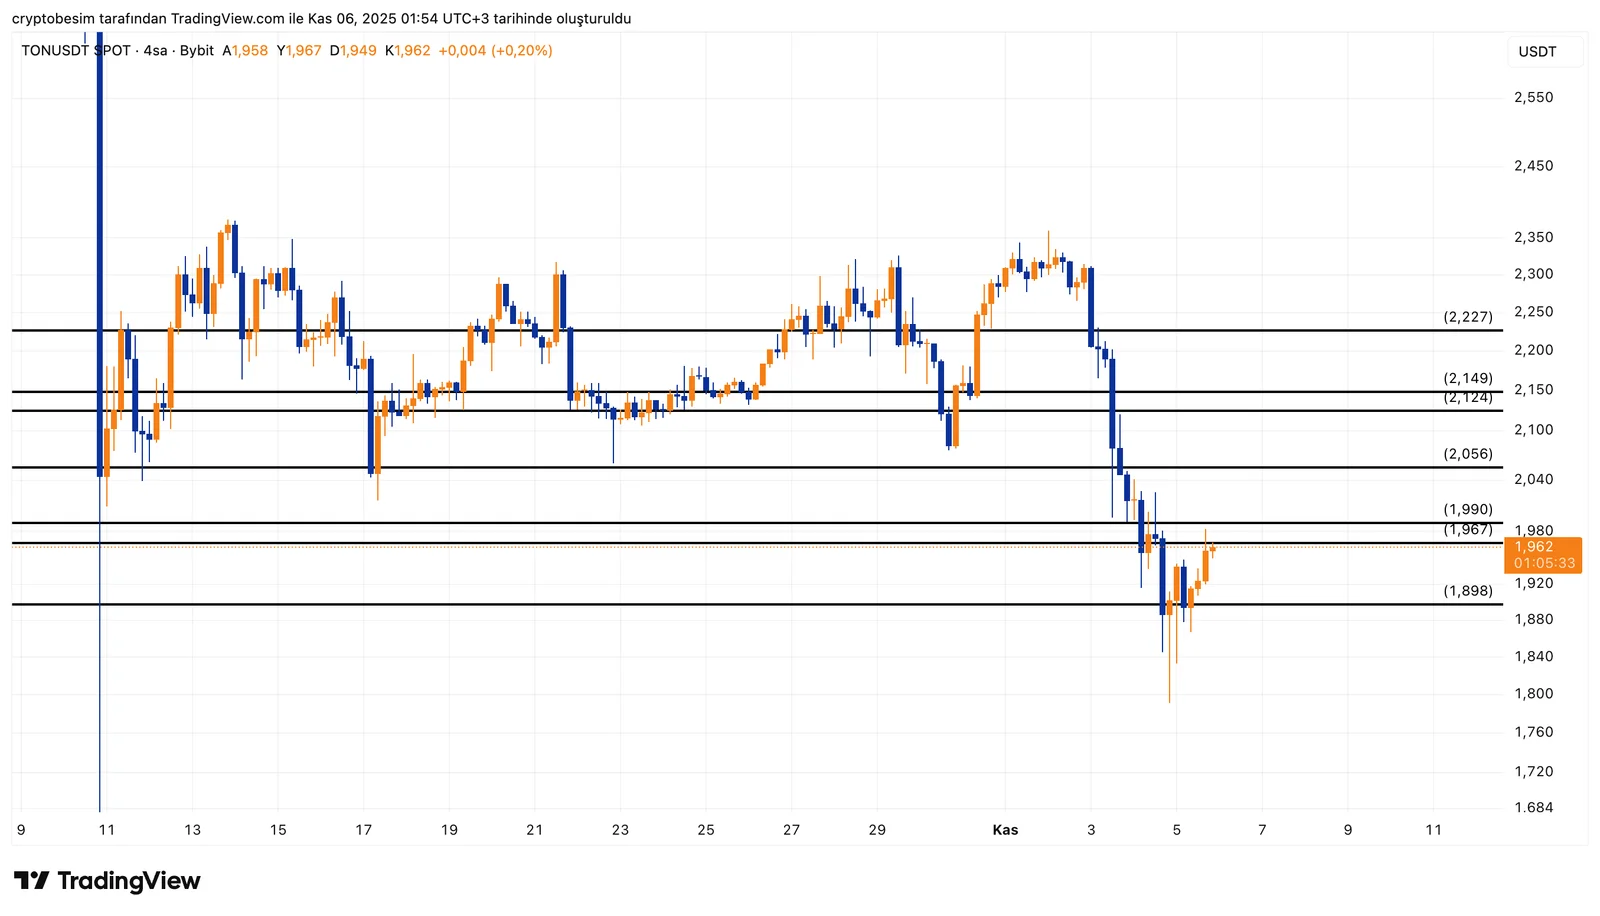
- Summary• TON is in a recovery phase, approaching Fibonacci resistance levels.• The 2.12–2.15 region poses a high short-term pullback risk.• As long as 1.89 support holds, the structure remains constructive.• A confirmed breakout could open the path toward 2.22.
These analyses, not offering any kind of investment advice, focus on support and resistance levels considered to offer trading opportunities in the short and medium term according to the market conditions. However, traders are responsible for their own actions and risk management. Moreover, it is highly recommended to use stop loss (SL) during trades.


