
TON/USDT Technical Analysis
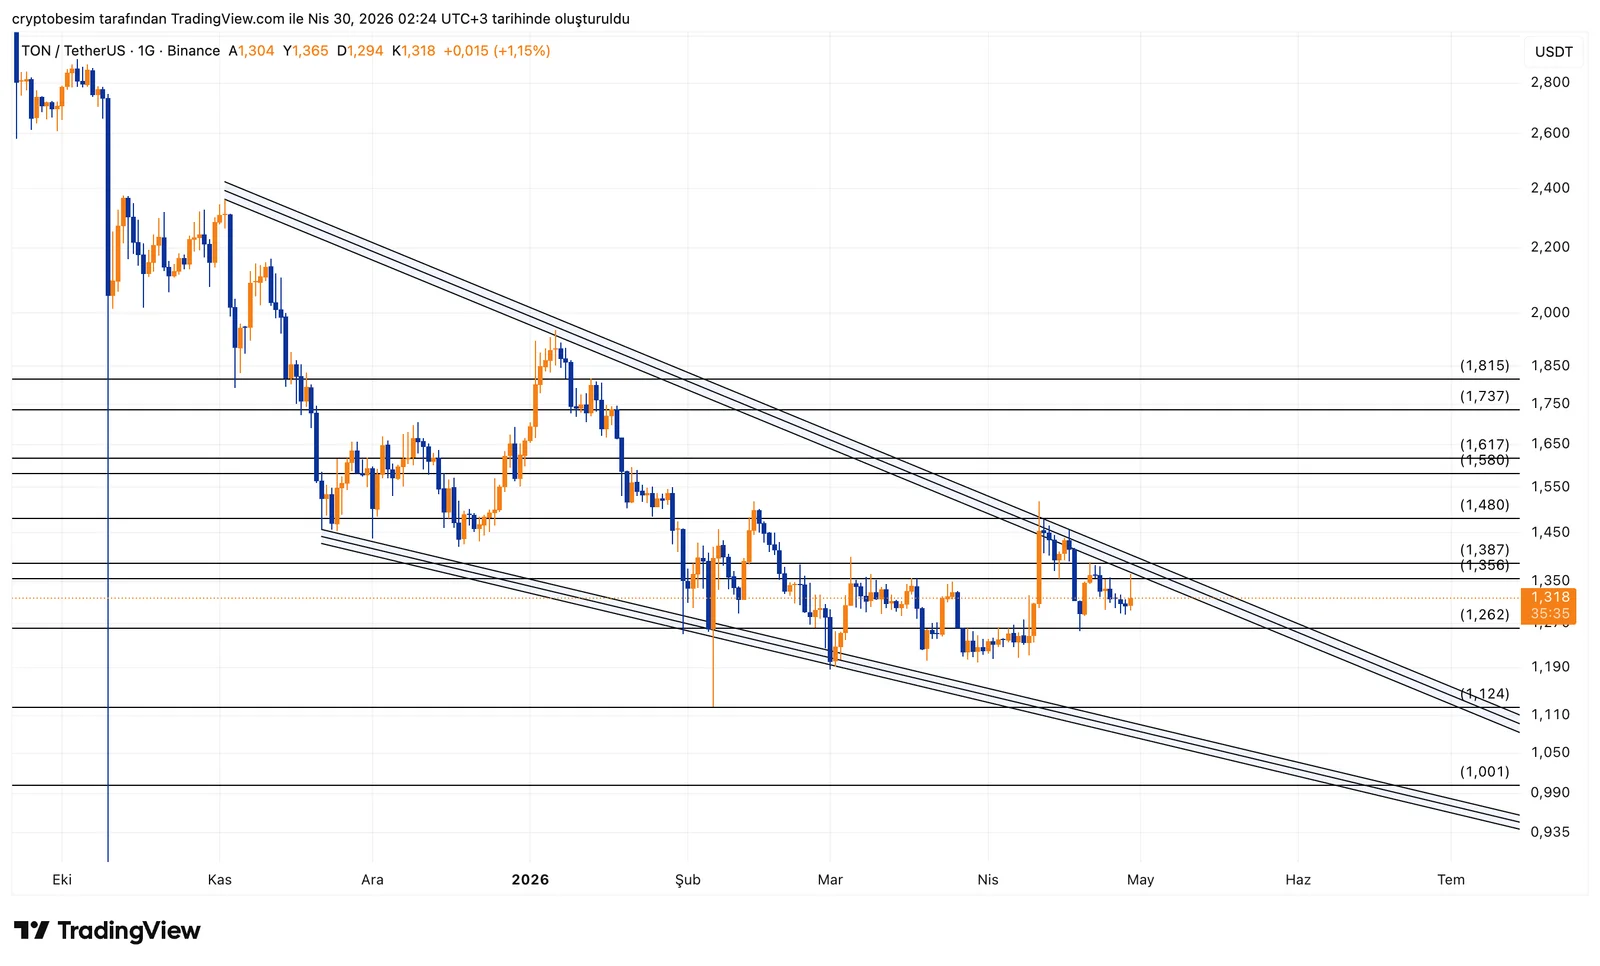
On TON, price continues to move within a falling wedge. At the current stage, price has directly touched the upper band. This means we are no longer in a waiting phase but in a decision zone.
On the daily chart, the 1.35 – 1.38 range acts as both horizontal resistance and overlaps with the trendline. That’s why a close above this area is important. If price holds above it, the structure would be considered a breakout to the upside.
In this scenario, the first target becomes the 1.48 – 1.58 range. Then 1.73 and levels above 1.80 come into play.
On the downside, the 1.30 – 1.28 range is the level that needs to hold in the short term. If this area is lost, price may fall back into the formation and a pullback toward the 1.26 – 1.20 range can be seen.
In short, price is at a critical resistance.If it holds above → upward movement acceleratesIf rejected → the current bearish structure continues
On the TON side, a notable development has been the significant reduction in transaction fees. With the new model, costs have been reduced by approximately 6x and the fee structure has been stabilized. This aims to allow users to maintain the same transaction cost even as network activity increases. Additionally, making some transactions completely free is also part of future plans. This approach shows that TON is directly focused on increasing user count and transaction volume; how much this move will be adopted will be the key factor going forward.
These analyses do not provide investment advice and focus on support and resistance levels that are considered to offer short- and medium-term trading opportunities depending on market conditions. However, responsibility for execution and risk management lies entirely with the user. In addition, the use of stop loss is strongly recommended.